Docsource mobile bookmarklet
As part of my focus on mobile performance I’ve been happily using the Mobile Perf bookmarklet. The information provided by Page Resources and DOM Monster are a great start at figuring out what’s going on in mobile web pages.
Last week I wanted to examine the use of transcoders on various carrier networks. The easiest way to do this is to look at the document source of the web page. But guess what? There’s no way to do that on most mobile browsers! So I wrote a bookmarklet for that and added it to Mobile Perf. Here’s the before and after shots.
| OLD | NEW |
|---|---|
 |
 |
That’s right – I created the new Docsource bookmarklet for viewing the page’s document source. It’s a piece of core functionality that is indispensable for analyzing websites. You can add the Docsource bookmarklet by itself, but I encourage you to add the Mobile Perf bookmarklet to get the entire collection of mobile bookmarklets.
Installation
MOBILE: Install the Mobile Perf bookmarklet on mobile devices as follows:
- click this link: Mobile Perf bookmarklet
- bookmark this page
- edit the bookmark URL and remove everything up to and including the hash (“
#“) so that the bookmark URL starts with “javascript:“
Here are step-by-step instructions for iPhone.
DESKTOP: It’s much easier to install on a desktop browser – just drag this link (Mobile Perf bookmarklet) to your bookmarks toolbar or add it to your favorites.
What it does
Here’s how Docsource works:
| Launching the Docsource bookmarklet displays a popup with two choices: |  |
| Expand the docsource in the current page… |  |
| …or click “open in new window” for a bigger view. |  |
| Zoom in to see the raw HTML. |  |
Access to document source is now yours – even in mobile browsers!
Before you say it let me agree – analyzing document source (and the information from other bookmarklets) on the mobile device is painful. I strongly believe that we want to gather performance data on the mobile device but analyze that data remotely. I’ve got something in the works to solve that problem and hope to announce it at my workshop at Webstock: The Long Tent in the Performance Pole. If you can’t make it to New Zealand don’t worry – I’ll do a simultaneous blog post.
Back to work…
bookmarklets for mobile: Mobile Perf and Page Resources
As I announced yesterday, I’m now focusing on mobile performance. Not surprisingly, I’ve laid claim to MobilePerf.com and MobilePerf.org. Right now they just redirect to my Mobile Perf home page. Step 1 is complete.
So – what should we do next?
I’m on my Nexus S and iPhone all the time and find surfing the Web to be agonizingly slow. That’s not a huge surprise – hence my current job as a performance wonk. (Oooo – that’s a good name – perfwonk.com and perfwonk.org booked.) Being a performance wonk I always wonder why the sites I visit are slow on mobile. To figure that out I need some visibility into mobile browsers.
The problem is the browser tools we use on our desktop (Firebug, Page Speed, YSlow, Dynatrace, Speed Tracer, etc.) don’t work on mobile devices. Many of these are browser add-ons which aren’t (yet) supported on mobile. Others are executables that are limited to specific OSes which don’t include any mobile OS.
I’ve built a bunch of browser tools. Before I start coding a new one I pause and ask myself, “Bookmarklet, Greasemonkey script, or add-on?” in that order. Here’s the high-level trade off analysis:
- Bookmarklets generally work across all browsers. They’re plain JavaScript which I know pretty well. But they have no special privileges, so things like same domain restrictions still apply.
- Greasemonkey scripts work across several of the major browsers. They’re mostly JavaScript with a small API that unfortunately varies by browser, so they’re slightly more complex to build than bookmarklets. The benefit over bookmarklets is they have greater functionality including automatic launching and cross-site XHR.
- Browser add-ons are the most powerful, but they’re also the most complex to build. The development stack is different in each browser, and most non-major browsers don’t support add-ons.
For mobile our hands are tied – bookmarklets are really the only choice right now. Over the weekend I wanted to start analyzing mobile browsers so I found some useful bookmarklets to do that: Firebug Lite, DOM Monster, SpriteMe, CSSess, and Zoompf. I also built a new one: Page Resources.
Setting up bookmarklets in a desktop browser is easy, but it’s more painful in mobile browsers. I wasn’t looking forward to setting up each of these bookmarklets on multiple devices, let alone evangelizing that to other mobile developers. In email with Thomas Fuchs about making DOM Monster open to the public (which he nicely did) he suggested I create a meta-bookmarklet that linked to these other bookmarklets. So I did!
Now you can install the Mobile Perf bookmarket and get access to a variety of other bookmarklets through a simple popup menu. One stop shopping for bookmarklets! This works equally well in desktop browsers, but it’s especially helpful on mobile where setting up bookmarklets is more time-consuming. (Checkout the step-by-step mobile installation instructions – quite a bit more complex than a simple drag-and-drop.)
You can see screenshots of each bookmarklet on the Mobile Perf bookmarket home page. As usual I could use help with the UI. (You can see mobileperfbkm.js and pageresources.js, so just send me patches.) Certainly send me bugs and suggestions for other bookmarklets you think should be added. Before sending a suggestion please test it on some mobile devices and make sure it works well.
Next I’ll be analyzing a bunch of websites and seeing if I can find some core issues. Plus I’ll be enhancing these tools and trying pcapperf with my new 13″ MackBook Air to generate HTTP waterfall charts and Page Speed reports.
Announcing my focus on mobile
For over a year I’ve been saying that I want to focus 100% of my time on mobile performance. I’m finally there. It might not be literally 100% of my time, but I hope to spend most of my research cycles investigating mobile.
My approach to building a practice around mobile performance will follow a similar path as what I did for desktop web:
- Measure
- Identify what to measure wrt performance and services to measure that.
- Profile
- Gather a set of tools that provide visibility into performance issues. Since there’s a lack of tools in this space we’ll have to build them.
- Research
- Analyze mobile performance problems using the identified tools and metrics.
- Best practices
- As a result of this research gather the tips & tricks that have the biggest impact on improving mobile performance.
- Evangelize
- Get the word out! Write case studies, blog posts, and books(?). Speak at conferences
- Lint
- Build tools that spot the performance problems that are most important to fix.
- Automate
- Provide services that automatically apply the performance fixes.
My initial focus is mobile devices over wifi. This allows me to nail down the behavior of mobile browsers independent of the wrinkles introduced by the mobile network. Once the mobile browser variables are well understood I’ll look at the idiosyncrasies of the mobile networks themselves. I’m especially excited to build an archive of transcoding behaviors that harm performance. I’ll dig into the performance of native apps once the behavior of mobile web performance is well understood.
I have a slightly ulterior motive for this announcement. I really want to speak at Mobilism May 12-13 in Amsterdam. (If you do mobile development make sure to register early.) Unfortunately, the speaker schedule is full so I have to convince the organizers I have enough good stuff to present that they need to somehow fit me into the schedule.
Tune back here tomorrow for my first announcement on mobile tools. (Assuming I finish it tonight.)
ControlJS part 3: overriding document.write
This is the third of three blog posts about ControlJS – a JavaScript module for making scripts load faster. The three blog posts describe how ControlJS is used for async loading, delayed execution, and overriding document.write.
The goal of ControlJS is to give developers more control over how JavaScript is loaded. The key insight is to recognize that “loading†has two phases: download (fetching the bytes) and execution (including parsing). In ControlJS part 1 I focused on the download phase using ControlJS to download scripts asynchronously. ControlJS part 2 showed how delaying script execution makes pages load faster, especially for Ajax web apps that download a lot of JavaScript that’s not used immediately. In this post I look at how document.write causes issues when loading scripts asynchronously.
I like ControlJS, but I’ll admit now that I was unable to solve the document.write problem to my satisfaction. Nevertheless, I describe the dent I put in the problem of document.write and point out two alternatives that do a wonderful job of making async work in spite of document.write.
Async and document.write
ControlJS loads scripts asynchronously. By default these async scripts are executed after window onload. If one of these async scripts calls document.write the page is erased. That’s because calling document.write after the document is loaded automatically calls document.open. Anything written to the open document replaces the existing document content. Obviously, this is not the desired behavior.
I wanted ControlJS to work on all scripts in the page. Scripts for ads are notorious for using document.write, but I also found scripts created by website owners that use document.write. I didn’t want those scripts to be inadvertently loaded with ControlJS and have the page get wiped out.
The problem was made slightly easier for me because ControlJS is in control when each inline and external script is being executed. My solution is to override document.write and capture the output for each script one at a time. If there’s no document.write output then proceed to the next script. If there is output then I create an element (for now a SPAN), insert it into the DOM immediately before the SCRIPT tag that’s being executed, and set the SPAN’s innerHTML to the output from document.write.
This works pretty well. I downloaded a local copy of CNN.com and converted it to ControlJS. There were two places where document.write was used (including an ad) and both worked fine. But there are issues. One issue I encountered is that wrapping the output in a SPAN can break certain behavior like hover handlers. But a bigger issue is that browsers ignore “<script…” added via innerHTML, and one of the main ways that ads use document.write is to insert scripts. I have a weak solution to this that parses out the “<script…” HTML and creates a SCRIPT DOM element with the appropriate SRC. It works, but is not very robust.
ControlJS is still valuable even without a robust answer for document.write. You don’t have to convert every script in the page to use ControlJS. If you know an ad or widget uses document.write you can load those scripts the normal way. Or you can test and see how complex the document.write is – perhaps it’s a use cases that ControlJS handles.
Real solutions for async document.write
I can’t end this series of posts without highlighting two alternatives that have solved the asynchronous document.write issue: Aptimize and GhostWriter.
Aptimize sells a web accelerator that changes HTML markup on the fly to have better performance. In September they announced the capability to load scripts asynchronously – including ads. As far as I know this is the first product that offered this feature. I had lunch with Ed and Derek from Aptimize this week and found out more about their implementation. It sounds solid.
Another solution is GhostWriter from Digital Fulcrum. Will contacted me and we had a concall and a few email exchanges about his implementation that uses an HTML parser on the document.write output. You can try the code for free.
Wrapping it up
ControlJS has many features including some that aren’t found in other script loading modules:
- downloads scripts asynchronously
- handles both inline scripts and external scripts
- delays script execution until after the page has rendered
- allows for scripts to be downloaded and not executed
- integrates with simple changes to HTML – no code changes
- solves some document.write async use cases
- control.js itself is loaded asynchronously
ControlJS is open source. I hope some of these features are borrowed and added to other script loaders. There’s still more features to implement (async stylesheets, better document.write handling) and ControlJS has had minimal testing. If you’d like to add features or fix bugs please take a look at the ControlJS project on Google Code and contact the group via the ControlJS discussion list.
ControlJS part 2: delayed execution
This is the second of three blog posts about ControlJS – a JavaScript module for making scripts load faster. The three blog posts describe how ControlJS is used for async loading, delayed execution, and overriding document.write.
The goal of ControlJS is to give developers more control over how JavaScript is loaded. The key insight is to recognize that “loading†has two phases: download (fetching the bytes) and execution (including parsing). In ControlJS part 1 I focused on the download phase using ControlJS to download scripts asynchronously. In this post I focus on the benefits ControlJS brings to the execution phase of script loading.
The issue with execution
The issue with the execution phase is that while the browser is parsing and executing JavaScript it can’t do much else. From a performance perspective this means the browser UI is unresponsive, page rendering stops, and the browser won’t start any new downloads.
The execution phase can take more time than you might think. I don’t have hard numbers on how much time is spent in this phase (although it wouldn’t be that hard to collect this data with dynaTrace Ajax Edition or Speed Tracer). If you do anything computationally intensive with a lot of DOM interaction the blocking effects can be noticeable. If you have a large amount of JavaScript just parsing the code can take a significant amount of time.
If all the JavaScript was used immediately to render the page we might have to throw up our hands and endure these delays, but it turns out that a lot of the JavaScript downloaded isn’t used right away. Across the Alexa US Top 10 only 29% of the downloaded JavaScript is called before the window load event. (I surveyed this using Page Speed‘s “defer JavaScript” feature.) The other 71% of the code is parsed and executed even though it’s not used for rendering the initial page. For these pages an average of 229 kB of JavaScript is downloaded. That 229 kB is compressed – the uncompressed size is upwards of 500 kB. That’s a lot of JavaScript. Rather than parse and execute 71% of the JavaScript in the middle of page loading, it would be better to avoid that pain until after the page is done rendering. But how can a developer do that?
Loading feature code
To ease our discussion let’s call that 29% of code used to render the page immediate-code and we’ll call the other 71% feature-code. The feature-code is typically for DHTML and Ajax features such as drop down menus, popup dialogs, and friend requests where the code is only executed if the user exercises the feature. (That’s why it’s not showing up in the list of functions called before window onload.)
Let’s assume you’ve successfully split your JavaScript into immediate-code and feature-code. The immediate-code scripts are loaded as part of the initial page loading process using ControlJS’s async loading capabilities. The additional scripts that contain the feature-code could also be loaded this way during the initial page load process, but then the browser is going to lock up parsing and executing code that’s not immediately needed. So we don’t want to load the feature-code during the initial page loading process.
Another approach would be to load the feature-code after the initial page is fully rendered. The scripts could be loaded in the background as part of an onload handler. But even though the feature-code scripts are downloaded in the background, the browser still locks up when it parses and executes them. If the user tries to interact with the page the UI is unresponsive. This unnecessary delay is painful enough that the Gmail mobile team went out of their way to avoid it. To make matters worse, the user has no idea why this is happening since they didn’t do anything to cause the lock up. (We kicked it off “in the background”.)
The solution is to parse and execute this feature-code when the user needs it. For example, when the user first clicks on the drop down menu is when we parse and execute menu.js. If the user never uses the drop down menu, then we avoid the cost of parsing and executing that code altogether. But when the user clicks on that menu we don’t want her to wait for the bytes to be downloaded – that would take too long especially on mobile. The best solution is to download the script in the background but delay execution until later when the code is actually needed.
Download now, Execute later
After that lengthy setup we’re ready to look at the delayed execution capabilities of ControlJS. I created an example that has a drop down menu containing the links to the examples.

In order to illustrate the pain from lengthy script execution I added a 2 second delay to the menu code (a while loop that doesn’t relinquish until 2 seconds have passed). Menu withOUT ControlJS is the baseline case. The page takes a long time to render because it’s blocked while the scripts are downloaded and also during the 2 seconds of script execution.
On the other hand, Menu WITH ControlJS renders much more quickly. The scripts are downloaded asynchronously. Since these scripts are for an optional feature we want to avoid executing them until later. This is achieved by using the “data-cjsexec=false” attribute, in addition to the other ControlJS modifications to the SCRIPT’s TYPE and SRC attributes:
<script data-cjsexec=false type="text/cjs" data-cjssrc="jquery.min.js"></script>
<script data-cjsexec=false type="text/cjs" data-cjssrc="fg.menu.js"></script>
The “data-cjsexec=false” setting means that the scripts are downloaded and stored in the cache, but they’re not executed. The execution is triggered later if and when the user exercises the feature. In this case, clicking on the Examples button is the trigger:
examplesbtn.onclick = function() {
   CJS.execScript("jquery.min.js");
   CJS.execScript("fg.menu.js", createExamplesMenu);
};
CJS.execScript() creates a SCRIPT element with the specified SRC and inserts it into the DOM. The menu creation function, createExamplesMenu, is passed in as the onload callback function for the last script. The 2 second delay is therefore incurred the first time the user clicks on the menu, but it’s tied to a the user’s action, there’s no delay to download the script, and the execution delay only occurs once.
The ability to separate and control the download phase and the execution phase during script loading is a key differentiator of ControlJS. Many websites won’t need this option. But websites that have a lot of code that’s not used to render the initial page, such as Ajax web apps, will benefit from avoiding the pain of script parsing and execution until it’s absolutely necessary.
ControlJS part 1: async loading
This is the first of three blog posts about ControlJS – a JavaScript module for making scripts load faster. The three blog posts describe how ControlJS is used for async loading, delayed execution, and overriding document.write.
The #1 performance best practice I’ve been evangelizing over the past year is progressive enhancement: deliver the page as HTML so it renders quickly, then enhance it with JavaScript. There are too many pages that are blank while several hundred kB of JavaScript is downloaded, parsed, and executed so that the page can be created using the DOM.
It’s easy to evangelize progressive enhancement – it’s much harder to actually implement it. That several hundred kB of JavaScript has to be unraveled and reorganized. All the logic that created DOM elements in the browser via JavaScript has to be migrated to run on the server to generate HTML. Even with new server-side JavaScript capabilities this is a major redesign effort.
I keep going back to Opera’s Delayed Script Execution option. Just by enabling this configuration option JavaScript is moved aside so that page rendering can come first. And the feature works – I can’t find a single website the suffers any errors with this turned on. While I continue to encourage other browser vendors to implement this feature, I want a way for developers to get this behavior sooner rather than later.
A number of web accelerators (like Aptimize, Strangeloop, FastSoft, CloudFlare, Torbit, and more recently mod_pagespeed) have emerged over the last year or so. They modify the HTML markup to inject performance best practices into the page. Thinking about this model I considered ways that markup could be changed to more easily delay the impact of JavaScript on progressive rendering.
The result is a JavaScript module I call ControlJS.
Controlling download and execution
The goal of ControlJS is to give developers more control over how JavaScript is loaded. The key insight is to recognize that “loading” has two phases: download (fetching the bytes) and execution (including parsing). These two phases need to be separated and controlled for best results.
Controlling how scripts are downloaded is a popular practice among performance-minded developers. The issue is that when scripts are loaded the normal way (<script src=""...) they block other resource downloads (lesser so in newer browsers) and also block page rendering (in all browsers). Using asynchronous script loading techniques mitigates these issues to a large degree. I wrote about several asynchronous loading techniques in Even Faster Web Sites. LABjs and HeadJS are JavaScript modules that provide wrappers for async loading. While these async techniques address the blocking issues that occur during the script download phase, they don’t address what happens during the script execution phase.
Page rendering and new resource downloads are blocked during script execution. With the amount of JavaScript on today’s web pages ever increasing, the blocking that occurs during script execution can be significant, especially for mobile devices. In fact, the Gmail mobile team thought script execution was such a problem they implemented a new async technique that downloads JavaScript wrapped in comments. This allows them to separate the download phase from the execution phase. The JavaScript is downloaded so that it resides on the client (in the browser cache) but since it’s a comment there’s no blocking from execution. Later, when the user invokes the associated features, the JavaScript is executed by removing the comment and evaluating the code.
Stoyan Stefanov, a former teammate and awesome performance wrangler, recently blogged about preloading JavaScript without execution. His approach is to download the script as either an IMAGE or an OBJECT element (depending on the browser). Assuming the proper caching headers exist the response is cached on the client and can later be inserted as a SCRIPT element. This is the technique used in ControlJS.
ControlJS: how to use it
To use ControlJS you need to make three modifications to your page.
Modification #1: add control.js
I think it’s ironic that JavaScript modules for loading scripts asynchronously have to be loaded in a blocking manner. From the beginning I wanted to make sure that ControlJS itself could be loaded asynchronously. Here’s the snippet for doing that:
var cjsscript = document.createElement('script');
cjsscript.src = "control.js";
var cjssib = document.getElementsByTagName('script')[0];
cjssib.parentNode.insertBefore(cjsscript, cjssib);
Modification #2: change external scripts
The next step is to transform all of the old style external scripts to load the ControlJS way. The normal style looks like this:
<script type="text/javascript" src="main.js"><script>
The SCRIPT element’s TYPE attribute needs to be changed to “text/cjs” and the SRC attribute needs to be changed to DATA-CJSSRC, like this:
<script type="text/cjs" data-cjssrc="main.js"><script>
Modification #3: change inline scripts
Most pages have inline scripts in addition to external scripts. These scripts have dependencies: inline scripts might depend on external scripts for certain symbols, and vice versa. It’s important that the execution order of the inline scripts and external scripts is preserved. (This is a feature that some of the async wrappers overlook.)Â Therefore, inline scripts must also be converted by changing the TYPE attribute from “text/javascript” in the normal syntax:
<script type="text/javascript">
var name = getName();
<script>
to “text/cjs”, like this:
<script type="text/cjs">
var name = getName();
<script>
That’s it! ControlJS takes care of the rest.
ControlJS: how it works
Your existing SCRIPTs no longer block the page because the TYPE attribute has been changed to something the browser doesn’t recognize. This allows ControlJS to take control and load the scripts in a more high performance way. Let’s take a high-level look at how ControlJS works. You can also view the control.js script for more details.
We want to start downloading the scripts as soon as possible. Since we’re downloading them as an IMAGE or OBJECT they won’t block the page during the download phase. And since they’re not being downloaded as a SCRIPT they won’t be executed. ControlJS starts by finding all the SCRIPT elements that have the “text/cjs” type. If the script has a DATA-CJSSRC attribute then an IMAGE (for IE and Opera) or OBJECT (for all other browsers) is created dynamically with the appropriate URL. (See Stoyan’s post for the full details.)
By default ControlJS waits until the window load event before it begins the execution phase. (It’s also possible to have it start executing scripts immediately or once the DOM is loaded.) ControlJS iterates over its scripts a second time, doing so in the order they appear in the page. If the script is an inline script the code is extracted and evaluated. If the script is an external script and its IMAGE or OBJECT download has completed then it’s inserted in the page as a SCRIPT element so that the code is parsed and executed. If the IMAGE or OBJECT download hasn’t finished then it reenters the iteration after a short timeout and tries again.
There’s more functionality I’ll talk about in later posts regarding document.write and skipping the execution step. For now, let’s look at a simple async loading example.
Async example
To show ControlJS’s async loading capabilities I’ve created an example that contains three scripts in the HEAD:
- main.js – takes 4 seconds to download
- an inline script that references symbols from main.js
- page.js – takes 2 seconds to download and references symbols from the inline script
I made page.js take less time than main.js to make sure that the scripts are executed in the correct order (even though page.js downloads more quickly). I include the inline script because this is a pattern I see frequently (e.g., Google Analytics) but many script loader helpers don’t support inline scripts as part of the execution order.
Async withOUT ControlJS is the baseline example. It loads the scripts in the normal way. The HTTP waterfall chart generated in IE8 (using HttpWatch) is shown in Figure 1. IE8 is better than IE 6&7 – it loads scripts in parallel so main.js and page.js are downloaded together. But all versions of IE block image downloads until scripts are done, so images 1-4 get pushed out. Rendering is blocked by scripts in all browsers. In this example, main.js blocks rendering for four seconds as indicated by the green vertical line.

Figure 1: Async withOUT ControlJS waterfall chart (IE8)
Async WITH ControlJS demonstrates how ControlJS solves the blocking problems caused by scripts. Unlike the baseline example, the scripts and images are all downloaded in parallel shaving 1 second off the overall download time. Also, rendering starts immediately. If you load the two examples in your browser you’ll notice how dramatically faster the ControlJS page feels. There are three more requests in Figure 2’s waterfall chart. One is the request for control.js – this is loaded asynchronously so it doesn’t slow down the page. The other two requests are because main.js and page.js are loaded twice. The first time is when they are downloaded asynchronously as IMAGEs. Later, ControlJS inserts them into the page as SCRIPTs in order to get their JavaScript executed. Because main.js and page.js are already in the cache there’s no download penalty, only the short cache read indicated by the skinny blue line.

Figure 2: Async WITH ControlJS waterfall chart (IE8)
The ControlJS project
ControlJS is open source under the Apache License. The control.js script can be found in the ControlJS Google Code project. Discussion topics can be created in the ControlJS Google Group. The examples and such are on my website at the ControlJS Home Page. I’ve written this code as a proof of concept. I’ve only tested it on the major browsers. It needs more review before being used in a production environment.
Only part 1
This is only the first of three blog posts about ControlJS. There’s more to learn. This technique might seem like overkill. If all we wanted to do was load scripts asynchronously some other techniques might suffice. But my goal is to delay all scripts until after the page has rendered. This means that we have to figure out how to delay scripts that do document.write. Another goal is to support requirements like Gmail mobile had – the desire to download JavaScript but delay the blocking penalties that come during script execution. I’ll be talking about those features in the next two blog posts.
var name = getName();
Velocity: Forcing Gzip Compression

Tony Gentilcore was my officemate when I first started at Google. I was proud of my heritage as “the YSlow guy”. After all, YSlow was well over 1M downloads. After a few days I found out that Tony was the creator of Fasterfox – topping 11M downloads. Needless to say, we hit it off and had a great year brainstorming techniques for optimizing web performance.
During that time, Tony was working with the Google Search team and discovered something interesting: ~15% of users with gzip-capable browsers were not sending an appropriate Accept-Encoding request header. As a result, they were sent uncompressed responses that were 3x bigger resulting in slower page load times. After some investigation, Tony discovered that intermediaries (proxies and anti-virus software) were stripping or munging the Accept-Encoding header. My blog post Who’s not getting gzip? summarizes the work with links to more information. Read Tony’s chapter in Even Faster Web Sites for all the details.
Tony is now working on Chrome, but the discovery he made has fueled the work of Andy Martone and others on the Google Search team to see if they could improve page load times for users who weren’t getting compressed responses. They had an idea:
For requests with missing or mangled Accept-Encoding headers, inspect the User-Agent to identify browsers that should understand gzip.
Test their ability to decompress gzip.
If successful, send them gzipped content!
This is a valid strategy given that the HTTP spec says that, in the absence of an Accept-Encoding header, the server may send a different content encoding based on additional information (such as the encodings known to be supported by the particular client).
During his presentation at Velocity, Forcing Gzip Compression, Andy describes how Google Search implemented this technique:
- At the bottom of a page, inject JavaScript to:
- Check for a cookie.
- If absent, set a session cookie saying “compression NOT ok”.
- Write out an iframe element to the page.
- The browser then makes a request for the iframe contents.
- The server responds with an HTML document that is always compressed.
- If the browser understands the compressed response, it executes the inlined JavaScript and sets the session cookie to “compression ok”.
- On subsequent requests, if the server sees the “compression ok” cookie it can send compressed responses.
The savings are significant. An average Google Search results page is 34 kB, which compresses down to 10 kB. The ability to send a compressed response cuts page load times by ~15% for these affected users.
Andy’s slides contain more details about how to only run the test once, recommended cookie lifetimes, and details on serving the iframe. Since this discovery I’ve talked to folks at other web sites that confirm these mysterious requests that are missing an Accept-Encoding header. Check it out on your web site – 15% is a significant slice of users! If you’d like to improve their page load times, take Andy’s advice and send them a compressed response that is smaller and faster.
Diffable: only download the deltas
There were many new products and projects announced at Velocity, but one that I just found out about is Diffable. It’s ironic that I missed this one given that it happened at Velocity and is from Google. The announcement was made during a whiteboard talk, so it didn’t get much attention. If your web site has large JavaScript downloads you’ll want to learn more about this performance optimization technique.
The Diffable open source project has plenty of information, including the Diffable slides used by Josh Harrison and James deBoer at Velocity. As explained in the slides, Diffable uses differential compression to reduce the size of JavaScript downloads. It makes a lot of sense. Suppose your web site has a large external script. When a new release comes out, it’s often the case that a bulk of that large script is unchanged. And yet, users have to download the entire new script even if the old script is still cached.
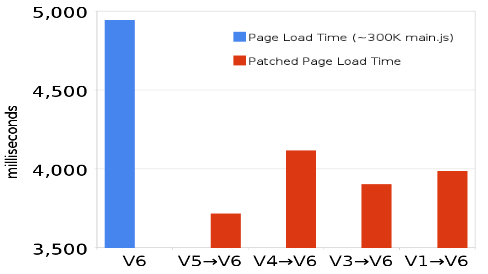
Josh and James work on Google Maps which has a main script that is ~300K. A typical revision for this 300K script produces patches that are less than 20K. It’s wasteful to download that other 280K if the user has the old revision in their cache. That’s the inspiration for Diffable.
Diffable is implemented on the server and the client. The server component records revision deltas so it can return a patch to bring older versions up to date. The client component (written in JavaScript) detects if an older version is cached and if necessary requests the patch to the current version. The client component knows how to merge the patch with the cached version and evals the result.
The savings are significant. Using Diffable has reduced page load times in Google Maps by more than 1200 milliseconds (~25%). Note that this benefit only affects users that have an older version of the script in cache. For Google Maps that’s 20-25% of users.
In this post I’ve used scripts as the example, but Diffable works with other resources including stylesheets and HTML. The biggest benefit is with scripts because of their notorious blocking behavior. The Diffable slides contain more information including how JSON is used as the delta format, stats that show there’s no performance hit for using eval, and how Diffable also causes the page to be enabled sooner due to faster JavaScript execution. Give it a look.
AutoHead – my first Browserscope user test
In the comments from my last blog post (appendChild vs insertBefore) someone asked which browsers do and don’t automatically create a HEAD element. This is important when you’re deciding how to dynamically add scripts to your web page. I used this question as the motivation for creating my first Browserscope user test. Here’s the story behind this new feature in Browserscope and the answer to the automatically create HEAD question. (You can run the AutoHead test to skip ahead and see the results.)
Level, Meta-level, Meta-meta-level
Level1: When Chrome was launched in 2008 I started a project called UA Profiler to analyze the performance characteristics of browsers. The key concept was to crowdsource gathering the data – publish the test framework and encourage the web community to run the tests on their browser of choice. There are numerous benefits to this approach:
- a wider variety of browsers are tested (more than I could possibly install in a test lab)
- results for new browsers happen immediately (often before the browser is officially released)
- tests are performed under real world conditions
Level 2: I teamed up with Lindsey Simon to take UA Profiler to the next level. The result was the launch of Browserscope. In addition to making this a functioning open source project, the framework was opened up to include multiple test categories. In addition to performance (renamed “Network“), other test categories were added: Security, Acid3, Selectors API, and Rich Text.
Level 3: A few weeks ago Lindsey took Browserscope to the next level with the addition of the User Tests feature. Now, anyone can add a test to Browserscope. In this early alpha version of the feature, users create one or more test pages on their own server, register the test with Browserscope, and embed a JavaScript snippet at the end of their test to send the results back to Browserscope for storing. The benefit for the test creator is that Browserscope stores all the data, parses the User-Agent strings for proper categorization, and provides a widget for viewing the results.
Even though Lindsey is careful to call this an alpha, it went very smoothly for me. Once I had my test page, it took less than 15 minutes to integrate with Browserscope and start gathering results. So let’s take a look at my test…
the test – AutoHead
In my appendChild vs insertBefore blog post I talk about why this code generates bugs:
document.getElementsByTagName('head')[0].appendChild(...)
The context was using this pattern in 3rd party code snippets – where you don’t have any control of the main page. It turns out that some web pages out in the wild wild web don’t use the HEAD tag. Luckily, most browsers automatically create a HEAD element if one isn’t specified in the page. Unfortunately, not all browsers do this.
In the comments on that blog post Andy asked, “What browsers are we talking about here?”
How can I possibly attempt to answer that question? It would require running a test on many different versions of many different browsers, including mobile devices. I’m not equipped with a setup to do that.
Then the light bulb lit up. ![]() I can do this with a Browserscope User Test!
I can do this with a Browserscope User Test!
Creating the test was easy. My HTML page doesn’t have a HEAD tag. I put a script at the bottom that checks if the page contains a head element:
bHead = document.getElementsByTagName('head').length;
I have to store the result in a specific variable that Browserscope looks for:
var _bTestResults = {
'autohead': bHead
};
This data structure is slurped up by Browserscope via this snippet (as shown on the User Tests Howto page):
(function() {
var _bTestKey = '<YOUR-TEST-ID-GOES-HERE>';
var _bScript = document.createElement('script');
_bScript.src = 'http://www.browserscope.org/user/beacon/'
               + _bTestKey;
_bScript.setAttribute('async', 'true');
var scripts = document.getElementsByTagName('script');
var lastScript = scripts[scripts.length - 1];
lastScript.parentNode.insertBefore(_bScript, lastScript);
})();
Voila! You’re done. Well, almost done. You still have to promote your test.
Promoting your test
With this small amount of work I’m now ready to ask the web community to help me gather results. For me personally, I accomplish this by writing this blog post asking for help:
Help me out by running the AutoHead test. Thanks!
You can view the Browserscope results here, so you can see results as they come in. So far iPhone and Safari 3.2 are the only browsers that don’t automatically create the HEAD element.
If you want to avoid bugs when dynamically adding scripts, you might want to use one of the more solid patterns mentioned in my appendChild vs insertBefore blog post. If you want to gather data on some browser test that interests you, read the Browserscope User Test Howto and go for it. If you have problems, contact the Browserscope mailing list. If you have success, contact me and I’ll tweet your test to drive more traffic to it. This is still in alpha, but I’m very excited about the possibilities. I can’t wait to see the kinds of tests you come up with.
Update: After just one day, thanks to all of you who ran the test, I’ve collected 400 measurements on 20 different browsers and 60 unique versions. The results show that the following browsers do NOT automatically create a HEAD element: Android 1.6, Chrome 5.0.307 (strange), iPhone 3.1.3, Nokia 90, Opera 8.50, Opera 9.27, and Safari 3.2.1. This adds up to over 1% of your users, so it’s important to keep this in mind when adding scripts dynamically.
I also had some comments I wanted to pass on about my Browserscope user test. In hindsight, I wish I had chosen a better “test_key” name for the _bTestResults object. I didn’t realize this would appear as the column header in my results table. Rather than “autohead” I would have done “Automatically Creates HEAD”. Also, rather than return 0 or 1, I wish I had returned “no” and “yes”. Finally, I wish there was a way to embed the results table widget besides using an iframe. I’ll file bugs requesting better documentation for these items.
WebPagetest.org – top tool
I’m loving WebPagetest.org. In Even Faster Web Sites I said, “[WebPagetest] hasn’t gotten the wide adoption it deserves.” It got a boost after Matt Cutts mentioned WebPageTest.org in his interview with WebProNews. But I still meet people who aren’t aware that this great performance tool is out there, so let me bang their drum some more.
Pat Meenan and Eric Goldsmith are the team behind AOL Pagetest and WebPagetest.org. AOL Pagetest is the Windows tool that works in IE. Pat took that and put it behind a web server running in his basement and called it WebPagetest. That was two years ago. He took the Open Source route and now there are instances of WebPagetest running in Virginia, California, UK, China, and New Zealand hosted by AOL as well as Strangeloop Networks, Aptimize, and Daemon Solutions.
The power of WebPagetest.org is that it’s web-based – you don’t have to do any installs and you can run it on any OS and browser. On the backend, WebPagetest runs the page in either IE7 or IE8 and displays the results. This might be a limitation for some folks – if you want to test a page on Mac OS X using Safari you’ll have to do that with some other tool. But the fact that IE 7&8 are the dominate browsers means you can see the most typical experience regardless of what platform you’re currently working on. Since many developers work on Mac using Safari or Firefox, and more are moving to Chrome, it’s important that they can easily see how their web pages load for a majority of their users.
New Test
Here’s how it works: Go to the New Test tab. Enter the URL you want to test and click submit. Pretty easy! 90% of the time that’s what I do, but there are other options you can tweak:
- pick a geo location – VA, CA, UK, CN, or NZ
- choose IE7 or IE8
- choose a connection speed – Dial, DSL, FIOS (Dial and DSL are done via throttling)
- test just the first (empty cache) page load or first and repeat
- repeat the test up to 10 times to get a bigger sample size
- opt to keep your test results private if desired

Results
The results page shows summary stats (page load times, bytes downloaded, # of HTTP requests) and a mini performance analysis (compression, image optimization, concatenating scripts and stylesheets). But the piece I love is the waterfall chart.

If you click on the mini waterfall, it takes you to a larger view where you can do additional customizations. I’ve been relying on this for my current series of blog posts on P3PC (performance of 3rd party content). And Pat even added a few options I requested. You can set the size of the image, remove certain requests (for example, I sometimes remove favicon.ico), and whether to show the extra bits on CPU and bandwidth utilization. I end up with clean waterfall charts like this:

And there’s more – Video!
When you create a new test, you can opt to record a video of the page loading (go to the Video tab under “Step 4 – Test Options” in the figure above). WebPagetest generates a filmstrip of images as well as a video. The image filmstrip shows what the page looks like as it loads. You can choose different time increments (0.1, 0.5, 1 and 5 seconds). Wikipedia is pretty straightforward as it loads. Here’s the filmstrip for FOX Sports. Content arrives in the 0-5 second range, more images (like the logo) are filled in from 5-10 seconds, and flash arrives by the 15 second mark. You can also view the video.

Pat does a lot of this work on his own time and all the video features are in Alpha, so be tolerant. I use WebPagetest.org daily and it has become one of my favorite performance tools. Definitely give it a try.