new Browserscope security tests
Browserscope is an open source project based on my earlier UA Profiler project. The goal is to help make browsers faster, safer, and more consistent. This is accomplished by having categories of tests that measure how browsers behave in different areas. Browserscope currently has these test categories: Network, Acid3, Selectors API, Rich Text, and Security.
The project is led by Lindsey Simon. Today he blogged about updates to the Browserscope security tests. The security test category was created by Collin Jackson (CMU) and Adam Barth (UC Berkeley). They worked with David Lin-Shung Huang and Mustafa Acer (both from CMU) on today’s release of tests for HTTP Origin Header, Strict Transport Security, Sandbox Attribute, X-Frame-Options, and X-Content-Type-Options. Check out their blog post for more details on what these tests actually do.
There are other new features in today’s release. We’ve updated the list of “top” browsers (notice we dropped IE 6). Lindsey added a dropdown menu to each test category for easier navigation. I run the Network test category. In that area I broke the overloaded parallel script loading test into four more specific tests that measure whether external scripts load in parallel with images, stylesheets, iframes, and other scripts. Brian Kuhn (Google) contributed a test for measuring whether the SCRIPT ASYNC attribute is supported.
One of the key aspects of Browserscope is that all the data is crowdsourced. This is critical. It allows the project to run without requiring a dedicated test lab. And the data is gathered under real world conditions. But to be successful, we need people in the web community to participate. When you’re done reading this post, point your browser to the Browserscope test page and click “Run All Tests”. It’ll only take a few minutes and you can sit back while it walks through all the tests automatically. We’re all in this together. Join us in making the web experience faster, safer, and more consistent.
Page Speed 1.6 Beta – new rules, native library
Page Speed 1.6 Beta was released today. There are a few big changes, but the most important fix is compatibility with Firefox 3.6. If you’re running the latest version of Firefox visit the download page to get Page Speed 1.6. Phew!
I wanted to highlight some of the new features mentioned in the 1.6 release notes: new rules and native library.
Three new rules were added as part of Page Speed 1.6:
- Specify a character set early – If you don’t specify a character set for your web pages or specify it too low in the page, the browser could parse it incorrectly. You can specify a character set using the META tag or in the Content-Type response header. Returning charset in the Content-Type header will ensure the browser sees it early. (See this Zoompf post for more information.)
- Minify HTML – Top performing web sites are already on top of this, right? Analyzing the Alexa U.S. top 10 shows an average savings of 8% if they minified their HTML. You can easily check your site with this new rule, and even save the optimized version.
- Minimize Request Size – Okay, this is cool and shows how Google tries to squeeze out every last drop of performance. This rule sees if the total size of the request headers exceed one packet (~1500 bytes). Requiring a roundtrip just to submit the request hurts performance, especially for users with high latency.
The other big feature I wanted to highlight first came out in Page Speed 1.5 but didn’t get much attention – the Page Speed C++ Native Library. It probably didn’t get much attention because it’s one of those changes that, if done correctly, no one notices. The work behind the native library involves porting the rules from JavaScript to C++. Why bother? Here’s what the release notes say:
Making Page Speed run faster is great, but the idea of implementing the performance logic in a C++ library so the rules can be run in other programs is very cool. And where have we seen this recently? In the Site Performance section recently added to Webmaster Tools. Now we have a server-side tool that produces the same recommendations found from running the Page Speed add-on. Here are the rules that have been ported to the native library:
added in 1.5:
|
added in 1.6:
|
Webmaster Tools Site Performance today shows recommendations based on the rules in native library 1.5. Now that more rules have been added to native library 1.6, webmasters can expect to see those recommendations in the near future. But this integration shouldn’t stop with Webmaster Tools. I’d love to see other tools and services integrate native library. If you’re interested in using native library, check out the page-speed project on Google Code and contact the page-speed-discuss Google Group.
Speed Tracer – visibility into the browser
Is it just me, or does anyone else think Google’s on fire lately, lighting up the world of web performance? Quick review of news from the past two weeks:
- timeline and heap profiler added to Chrome Dev Tools
- Google Analytics publishes async script loading pattern
- latency and Page Speed recommendations added to Webmaster Tools
- deep dive into what makes Chrome (and browsers in general) fast
- Google Public DNS launched
- and now… the release of Speed Tracer
Speed Tracer was my highlight from last night’s Google Campfire One. The event celebrated the release of GWT 2.0. Performance and “faster” were emphasized again and again throughout the evening’s presentations (I love that). GWT’s new code splitting capabilities are great for performance, but Speed Tracer easily wowed the audience – including me. In this post, I’ll describe what I like about Speed Tracer, what I hope to see added next, and then I’ll step back and talk about the state of performance profilers.
Getting started with Speed Tracer
Some quick notes about Speed Tracer:
- It’s a Chrome extension, so it only runs in Chrome. (Chrome extensions is yet another announcement this week.)
- It’s written in GWT 2.0.
- It works on all web sites, even sites that don’t use GWT.
The Speed Tracer getting started page provides the details for installation. You have to be on the Chrome dev channel. Installing Speed Tracer adds a green stopwatch to the toolbar. Clicking on the icon starts Speed Tracer in a separate Chrome window. As you surf sites in the original window, the performance information is shown in the Speed Tracer window.
Beautiful visibility
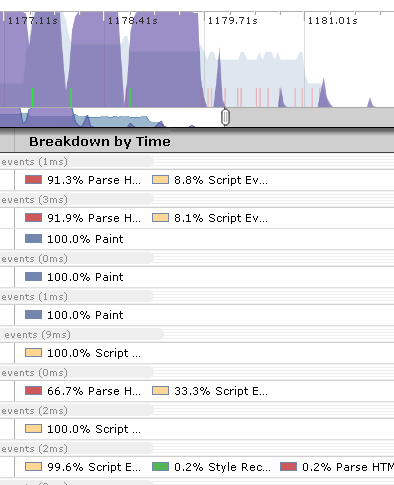
When it comes to optimizing performance, developers have long been working in the dark. Without the ability to measure JavaScript execution, page layout, reflows, and HTML parsing, it’s not possible to optimize the pain points of today’s web apps. Speed Tracer gives developers visibility into these parts of page loading via the Sluggishness view, as shown here. (Click on the figure to see a full screen view.) Not only is this kind of visibility great, but the display is just, well, beautiful. Good UI and dev tools don’t often intersect, but when they do it makes development that much easier and more enjoyable.
Speed Tracer also has a Network view, with the requisite waterfall chart of HTTP requests. Performance hints are built into the tool flagging issues such as bad cache headers, exceedingly long responses, Mozilla cache hash collision, too many reflows, and uncompressed responses. Speed Tracer also supports saving and reloading the profiled information. This is extremely useful when working on bugs or analyzing performance with other team members.
Feature requests
I’m definitely going to be using Speed Tracer. For a first version, it’s extremely feature rich and robust. There are a few enhancements that will make it even stronger:
- overall pie chart – The “breakdown by time” for phases like script evaluation and layout are available for segments within a page load. As a starting point, I’d like to see the breakdown for the entire page. When drilling down on a specific load segment, this detail is great. But having overall stats will give developers a clue where they should focus most of their attention.
- network timing – Similar to the issues I discovered in Firebug Net Panel, long-executing JavaScript in the main page blocks the network monitor from accurately measuring the duration of HTTP requests. This will likely require changes to WebKit to record event times in the events themselves, as was done in the fix for Firefox.
- .HAR support – Being able to save Speed Tracer’s data to file and share it is great. Recently, Firebug, HttpWatch, and DebugBar have all launched support for the HTTP Archive file format I helped create. The format is extensible, so I hope to see Speed Tracer support the .HAR file format soon. Being able to share performance information across tools and browsers is a necessary next step. That’s a good segue…
Developers need more
Three years ago, there was only one tool for profiling web pages: Firebug. Developers love working in Firefox, but sometimes you just have to profile in Internet Explorer. Luckily, over the last year we’ve seen some good profilers come out for IE including MSFast , AOL Pagetest, WebPagetest.org, and dynaTrace Ajax Edition. DynaTrace’s tool is the most recent addition, and has great visibility similar to Speed Tracer, as well as JavaScript debugging capabilities. There have been great enhancements to Web Inspector, and the Chrome team has built on top of that adding timeline and memory profiling to Chrome. And now Speed Tracer is out and bubbling to the top of the heap.
The obvious question is:
Which tool should a developer choose?
But the more important question is:
Why should a developer have to choose?
There are eight performance profilers listed here. None of them work in more than a single browser. I realize web developers are exceedingly intelligent and hardworking, but no one enjoys having to use two different tools for the same task. But that’s exactly what developers are being asked to do. To be a good developer, you have to be profiling your web site in multiple browsers. By definition, that means you have to install, learn, and update multiple tools. In addition, there are numerous quirks to keep in mind when going from one tool to another. And the features offered are not consistent across tools. It’s a real challenge to verify that your web app performs well across the major browsers. When pressed, rock star web developers I ask admit they only use one or two profilers – it’s just too hard to stay on top of a separate tool for each browser.
This week at Add-on-Con, Doug Crockford’s closing keynote is about the Future of the Web Browser. He’s assembled a panel of representatives from Chrome, Opera, Firefox, and IE. (Safari declined to attend.) My hope is they’ll discuss the need for a cross-browser extension model. There’s been progress in building protocols to support remote debugging: WebDebugProtocol and Crossfire in Firefox, Scope in Opera, and ChromeDevTools in Chrome. My hope for 2010 is that we see cross-browser convergence on standards for extensions and remote debugging, so that developers will have a slightly easier path for ensuring their apps are high performance on all browsers.
Chrome dev tools
I just finished reading the latest post on the Chromium Blog: An Update for Google Chrome’s Developer Tools. Dynatrace’s Ajax Edition was impressive – just take a look at what John Resig had to say. I’m also impressed by what’s been added to WebKit’s Web Inspector and Chrome’s dev tools. You should definitely take them for a spin, but I’ll give you a preview here.
A key part to any tool’s success is the assurance that there’s support behind it in the way of documentation, tutorials, issue tracking, etc. This blog post links to the new chrome dev tools site that has been put together, including several video tutorials. I spent most of my time walking through the full tutorial. To see these new tools, make sure to get on the Chrome dev channel. Finally, any issues can be seen and added via the chromium issues page.
Once you’ve got the latest Chrome dev release, you can access these tools by clicking on the Page menu (![]() ) and select Developer -> Developer Tools. There are six panels to choose from. The Elements panel shows the DOM tree. A nice feature here is the ability to see the event listeners, including anonymous functions, attached to any element.
) and select Developer -> Developer Tools. There are six panels to choose from. The Elements panel shows the DOM tree. A nice feature here is the ability to see the event listeners, including anonymous functions, attached to any element.
Much of my time analyzing web sites is spent looking at HTTP waterfall charts. This is captured in the Resources panel. Since this slows down web sites, it’s off by default. You can make it enabled permanently or for the current session. Doing so reloads the current web page automatically so you can see the HTTP waterfall chart. The DOMContentLoaded and Onload events are shown (blue and red vertical lines respectively). This is incredibly helpful for developers who are tuning their page for faster performance, so they can confirm deferred actions are happening at the right time. The only other tool I know that does this is Firebug’s Net panel.
JavaScript debugging has gotten some major enhancements including conditional breakpoints and watch expressions.
Developers can finally get insight into where their page’s load time is being spent by looking at the Timeline panel. In order to get timeline stats, you have to start and stop profiling by clicking on the round dot in the status bar at the bottom. The overall page load sequence is broken up into time segments spent on loading, JavaScript execution, and rendering.
The most differentiating features show up in the Profiles panel. Here, you can track CPU and memory (heap) stats. A couple other tools track CPU, but this is the only tool I’m aware of that tracks heap for each type of constructor.
Most of these features are part of WebKit’s Web Inspector. The new features added by the Chrome team are the timeline and heap panels. All of these improvements have arrived in the last month, and result in a tool that any web developer will find useful, especially for building even faster web sites.
Security tests added to Browserscope
Today, the first new test suite for Browserscope was launched: Security.
Browserscope is an open source project for measuring browser capabilities. It’s a resource for users and developers to see which features are or are not supported by any particular browser. All of the data is crowdsourced, making the results more immediate, diverse, and representative. Browserscope launched in September (see my blog post) with tests for network performance, CSS selectors, rich text edit controls, and Acid3.
The new security tests in Browserscope were developed by Adam Barth from UC Berkeley, and Collin Jackson and Mustafa Acer from Carnegie Mellon University. It’s exciting to have these experts become Browserscope contributors. The tests cover such areas as postMessage API, JSON.parse API, httpOnly cookie attribute, and cross-origin capability leaks. See the Security about page to read about all the tests.
This is the point at which you can contribute. We don’t want your money – all we want is a little bit of your time to run the tests. Just click on the link and sit back. All that’s needed is a web client that supports JavaScript. We especially want people to connect using their mobile devices. If you have suggestions about the tests, contact us or submit a bug.
So far we’ve collected over 30,000 test results from 580 different browsers. Want to see how your browser compares? Just click on this button to add your browser’s results to Browserscope.
Firebug Net Panel: more accurate timing
There’s a lot of work that transpires before I can recommend a performance tool. I have to do a large amount of testing to verify the tool’s accuracy, and frequently (more often than not) that testing reveals inaccuracies.
Like many web developers, I love Firebug and have been using it since it first came out. Firebug’s Net Panel, thanks to Jan (“Honza”) Odvarko, has seen huge improvements over the last year or so: customized columns, avoiding confusion between real requests vs. cache reads, new (more colorful!) UI, and the recent support of export.
Until now, Net Panel suffered from an accuracy problem: because Net Panel reads network events in the same JavaScript thread as the main page, it’s possible for network events to be blocked resulting in inaccurate time measurements. Cuzillion is helpful here to create a test case. This example has an image that takes 1 second to download, followed by an inline script that takes 5 seconds to execute, and finally another 1 second image. Even though the first image is only 1 second, the “done” network event is blocked for 5 seconds while the inline script executes. In Firebug 1.4’s Net Panel, this image incorrectly appears to take 5 seconds to download, instead of just 1 second:

Honza has come through again, delivering a fix to this problem in Firebug 1.5 (currently in beta as firebug-1.5X.0b1 which requires Firefox 3.6 beta). The fix included help from the Firefox team to add the actual time to each network event. The results are clearly more accurate:

A few other nice features to point out: Firebug Net Panel is the only packet sniffer I’m aware of that displays the DOMContentLoaded and onload events (blue and red vertical line). Firebug 1.5 Net Panel has multiple columns available, and the ability to customize which columns you want to display:

With these new features and improved timing accuracy, Firebug Net Panel is a great choice for analyzing HTTP traffic in your web pages. If you’re not subscribed to Honza’s blog, I recommend you sign up. He’s always working on something new that’s helpful to web developers and especially to Firebug users.
Note 1: Remember, you need both Firefox 3.6 beta and firebug-1.5X.0b1 to see the new Net Panel.
Note 2: This is being sent from Malmö, Sweden where I’m attending Øredev.
HTTP Archive Specification: Firebug and HttpWatch
A few years ago, I set a goal to foster the creation of an Internet Performance Archive. The idea is similar to the Internet Archive. But whereas the Internet Archive’s Wayback Machine provides a history of the Web’s state of HTML, IPA would provide a history of the Web’s state of performance: total bytes downloaded, number of images|scripts|stylesheets, use of compression, etc. as well as results from performance analysis tools like YSlow and Page Speed. Early versions of this idea can be seen in Show Slow and Cesium.
I realized that a key ingredient to this idea was a way to capture the page load experience, basically, a way to save what you see in a packet sniffer. Wayback Machine archives HTML, but it doesn’t capture critical parts of the page load experience like the page’s resources (scripts, stylesheets, etc.) and their HTTP headers. It’s critical to capture this information so that the performance results can be viewed in the context of what was actually loaded and analyzed.
What’s needed is an industry standard for archiving HTTP information. The first step in establishing that industry standard took place today with the announcement of HttpWatch and Firebug joint support of the HTTP Archive format.
HttpWatch has long supported exporting HTTP information. That’s one of the many reasons why it’s the packet sniffer I use almost exclusively. Earlier this year, as part of the Firebug Working Group, I heard that Firebug wanted to add an export capability for Net Panel. I suggested that, rather than create yet another proprietary format, Firebug team up with HttpWatch to develop a common format, and drive that forward as a proposal for an industry standard. I introduced Simon Perkins (HttpWatch) and Jan “Honza” Odvarko (main Net Panel developer), then stepped back as they worked together to produce today’s announcement.
The HTTP Archive format (HAR for short – that was my contribution ;-) is in JSON format. You can see it in action in HttpWatch 6.2, released today. HAR has been available in Firebug for a month or so. You need Firebug 1.5 alpha v26 or later and Honza’s NetExport add-on (v0.7b5 or later).
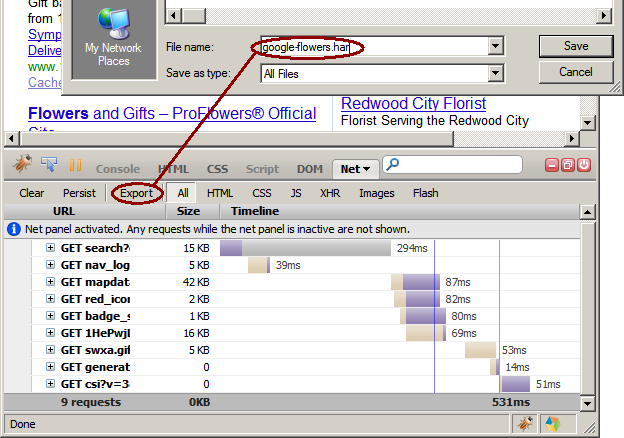
Here’s what the end-to-end workflow looks like. After installing NetExport, the “Export” button is added to Firebug Net Panel. Selecting this, I can save the HTTP information for my Google flowers search to a file called “google-flowers.har”.
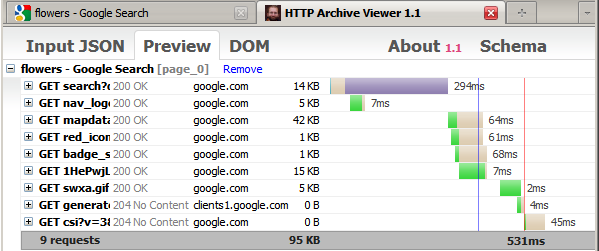
After saving the file, it’s automatically displayed in Honza’s HTTP Archive Viewer web page:
I can then open the file in HttpWatch:
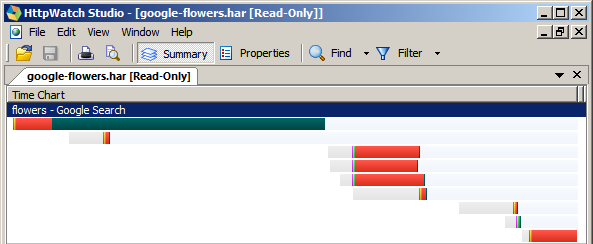
I’m incredibly excited to see this milestone reached, thanks to the work of Honza and Simon. I encourage other vendors and projects to add support for HAR files. The benefits aren’t limited to performance analysis. Having a format for sharing HTTP data across tools and browsers is powerful for debugging and testing, as well. One more block added to the web performance foundation. Thank you HttpWatch and Firebug!
Aptimize: realtime spriting and more
I love evangelizing high performance best practices and engaging with developers who are focused on delivering a fast user experience. Helping to optimize the Web appeals to the (speed)geek in me, and my humanitarian side feels good about creating a better user experience.
There are many companies and developers out there that go the extra mile to deliver a fast web page. My hat’s off to you all. It can be hard to maintain a high performance development process day-in-and-day-out. Heck, it can be hard to even understand all the performance optimizations that are possible, and which ones make sense for you. I savor the challenge this presents, for the same reason that I resonate with what Jimmy Dugan (Tom Hanks) says to Dottie Hinson (Geena Davis) in A League of Their Own when she complains about how hard playing baseball is:
It’s supposed to be hard. If it wasn’t hard, everyone would do it. The hard… is what makes it great.
As much as I love the skills it takes to build fast web sites, I also want a majority of sites on the Web to get a YSlow A. Right now, the bar is just too high. For fast web sites to become pervasive, web development needs to be fast by default. Performance best practices need to be baked into the most popular development frameworks and happen automatically. We’re seeing this with browsers (parallel script loading, faster JavaScript engines, etc.) and in some frameworks (such as SproutCore and WordPress). I predict we’ll see more frameworks and tools that deliver this fast by default promise. And that’s where Aptimize comes in.
I’ve been tracking Aptimize for about a year since they contacted me about their Website Accelerator. I was psyched to have them present at and sponsor Velocity. Website Accelerator changes web pages in real time and injects many of the performance best practices from my books, plus some others that aren’t in my books. It’s a server-side module that runs on Microsoft Sharepoint, ASP.NET, and Linux/Apache. One of their more high profile users wrote up the results last week in this blog post: How we did it: Speeding up SharePoint.Microsoft.com.
Here are some of the before-vs-after stats:
- # of HTTP requests empty cache went from 96 to 35
- # of HTTP requests primed cache went from 50 to 9
- empty cache page load times were reduced 46-64%
- primed cache page load times were reduced 15-53%
These results were achieved by automatically applying the following changes to the live pages as they left the server:
- concatenate scripts together (goes from 18 to 11 requests)
- concatenate stylesheets together (goes from 17 to 5 requests)
- create CSS sprites and inline images using data: URIs (goes from 38 to 13 requests)
- add a far future Expires header
- remove duplicate scripts and stylesheets
- minify (remove whitespace, etc.) in scripts and stylesheets
You can see the results by visiting sharepoint.microsoft.com. (Compare the optimized page to the before page by adding “?wax=off” to the URL. Get it? “wax=on”, “wax=off”?? The Aptimize team is from New Zealand, so they’re always up for a good laugh. Note that once you use the querystring trick you might have to clear your cookies to move between versions.) You know you’re looking at the optimized page if you see URLs that start with “http://sharepoint.microsoft.com/wax.axd/…”.
With my recent work on SpriteMe, I was most interested in how they did CSS sprites and used data: URIs. Here’s one of the sprites Aptimize Website Accelerator created automatically. They don’t create it on-the-fly for every page. They create the sprite image and cache it, then reuse it on subsequent pages.
I was especially impressed with the work they did using data: URIs. Data: URIs are a technique for avoiding the extra HTTP request for files (typically images) by embedding the encoded response data directly in the HTML document. The main problem with data: URIs is that they’re not supported in IE7 and earlier. Recent blogs from web dev performance rock stars Stoyan Stefanov and Hedger Wang discuss a workaround for early versions of IE using MHTML. Aptimize has already incorporated these techniques into their product.
To see this in action, go to sharepoint.microsoft.com in a browser other than IE. I’m using Firefox with Firebug. Inspect the printer icon next to “print friendly” at the bottom of the page and you’ll notice the background-image style looks like this:
url(data:image/gif;base64,R0lGODlhGAAaALMJA...
That’s the base64-encoded image. It’s declared in the MSCOMSP-print rule inside this Aptimize-generated stylesheet.
Inspect the same “print friendly” icon in IE7 and you’ll see this background-image:
url("mhtml:http://sharepoint.microsoft.com/wax.axd/cache/2fpw31-aG1G4JD2$a$MeCg.mhtx!I_aWWORG5UHNr6iB8dIowgoA")
This is worth understanding: “mhtml” tells IE this is MIME HTML. The URL, http://sharepoint.microsoft.com/wax.axd/cache/2fpw31-aG1G4JD2$a$MeCg.mhtx, points to multipart response. The location, I_aWWORG5UHNr6iB8dIowgoA, identifies which part of the multipart response to use. There we find the same base64-encoding of the printer icon.
Most sites avoid data: URIs because of lack of cross-browser support. The MHTML workaround has been known for awhile, but I don’t know of many web sites that understand this technique, let alone use it. And here we have a tool that adds this technique to your web site automatically. Well done, Aptimize.
dynaTrace Ajax Edition: tracing JS performance
DynaTrace has been around for several years focusing on the performance analysis of backend applications. They entered the frontend performance arena last week with the release of dynaTrace Ajax Edition. It’s a free tool that runs in IE as a browser helper object (BHO). I tried it out and was pleased. It’s important to have development tools that work in IE. I love Firefox and all its add-ons, but I also know how important it is to test on IE and more importantly to be able to debug on IE.
Once you’ve downloaded and installed DAE (my shorthand name for dynaTrace Ajax Edition), don’t be fooled if you don’t see an easy way to start it from within IE. You have to go under Programs in the Start Menu and find the dynaTrace program group. Entering a URL for the first test run is obvious. For subsequent runs, click on the “play” icon’s menu and pick “New Run Configuration…” and enter a different URL. One of the nice features of DAE is that it can run during a multi-page workflow. You can enter the starting URL, and then navigate to other pages or launch Ajax features while DAE monitors everything in the background. When you close IE you can dig into all the info DAE has gathered.
DAE gathers a ton of information on your web app. My main issue is that there’s so much information you really need to play with it for awhile to discover what it can do. This isn’t a bad thing – slightly challenging at the beginning, but once you know how to navigate through the UI you’ll find the answer for almost any performance or profiling question you have. I kept finding new windows that revealed different views of the information DAE had collected.
The main differentiator of DAE is all the JavaScript profiling it does. Time is broken out in various ways including by event triggers and by JavaScript API (libraries). It has an HTTP waterfall chart. A major feature is the ability to save the DAE analysis, so you can examine it later and share it with colleagues. There are other features that are more subtle, but pleasant to run into. For example, DAE automatically UNminifies JavaScript code, so you can look at a prettified version when debugging a live site.
When it comes to analyzing your JavaScript code to find what’s causing performance issues, dynaTrace Ajax Edition has the information to pinpoint the high-level area all the way down to the actual line of code that needs to be improved. I recommend you give it a test run and add it to your performance tool kit.
