Speed Tracer – visibility into the browser
Is it just me, or does anyone else think Google’s on fire lately, lighting up the world of web performance? Quick review of news from the past two weeks:
- timeline and heap profiler added to Chrome Dev Tools
- Google Analytics publishes async script loading pattern
- latency and Page Speed recommendations added to Webmaster Tools
- deep dive into what makes Chrome (and browsers in general) fast
- Google Public DNS launched
- and now… the release of Speed Tracer
Speed Tracer was my highlight from last night’s Google Campfire One. The event celebrated the release of GWT 2.0. Performance and “faster” were emphasized again and again throughout the evening’s presentations (I love that). GWT’s new code splitting capabilities are great for performance, but Speed Tracer easily wowed the audience – including me. In this post, I’ll describe what I like about Speed Tracer, what I hope to see added next, and then I’ll step back and talk about the state of performance profilers.
Getting started with Speed Tracer
Some quick notes about Speed Tracer:
- It’s a Chrome extension, so it only runs in Chrome. (Chrome extensions is yet another announcement this week.)
- It’s written in GWT 2.0.
- It works on all web sites, even sites that don’t use GWT.
The Speed Tracer getting started page provides the details for installation. You have to be on the Chrome dev channel. Installing Speed Tracer adds a green stopwatch to the toolbar. Clicking on the icon starts Speed Tracer in a separate Chrome window. As you surf sites in the original window, the performance information is shown in the Speed Tracer window.

Beautiful visibility
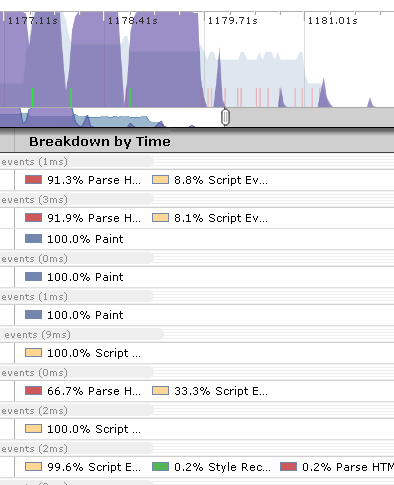
When it comes to optimizing performance, developers have long been working in the dark. Without the ability to measure JavaScript execution, page layout, reflows, and HTML parsing, it’s not possible to optimize the pain points of today’s web apps. Speed Tracer gives developers visibility into these parts of page loading via the Sluggishness view, as shown here. (Click on the figure to see a full screen view.) Not only is this kind of visibility great, but the display is just, well, beautiful. Good UI and dev tools don’t often intersect, but when they do it makes development that much easier and more enjoyable.
Speed Tracer also has a Network view, with the requisite waterfall chart of HTTP requests. Performance hints are built into the tool flagging issues such as bad cache headers, exceedingly long responses, Mozilla cache hash collision, too many reflows, and uncompressed responses. Speed Tracer also supports saving and reloading the profiled information. This is extremely useful when working on bugs or analyzing performance with other team members.
Feature requests
I’m definitely going to be using Speed Tracer. For a first version, it’s extremely feature rich and robust. There are a few enhancements that will make it even stronger:
- overall pie chart – The “breakdown by time” for phases like script evaluation and layout are available for segments within a page load. As a starting point, I’d like to see the breakdown for the entire page. When drilling down on a specific load segment, this detail is great. But having overall stats will give developers a clue where they should focus most of their attention.
- network timing – Similar to the issues I discovered in Firebug Net Panel, long-executing JavaScript in the main page blocks the network monitor from accurately measuring the duration of HTTP requests. This will likely require changes to WebKit to record event times in the events themselves, as was done in the fix for Firefox.
- .HAR support – Being able to save Speed Tracer’s data to file and share it is great. Recently, Firebug, HttpWatch, and DebugBar have all launched support for the HTTP Archive file format I helped create. The format is extensible, so I hope to see Speed Tracer support the .HAR file format soon. Being able to share performance information across tools and browsers is a necessary next step. That’s a good segue…
Developers need more
Three years ago, there was only one tool for profiling web pages: Firebug. Developers love working in Firefox, but sometimes you just have to profile in Internet Explorer. Luckily, over the last year we’ve seen some good profilers come out for IE including MSFast , AOL Pagetest, WebPagetest.org, and dynaTrace Ajax Edition. DynaTrace’s tool is the most recent addition, and has great visibility similar to Speed Tracer, as well as JavaScript debugging capabilities. There have been great enhancements to Web Inspector, and the Chrome team has built on top of that adding timeline and memory profiling to Chrome. And now Speed Tracer is out and bubbling to the top of the heap.
The obvious question is:
Which tool should a developer choose?
But the more important question is:
Why should a developer have to choose?
There are eight performance profilers listed here. None of them work in more than a single browser. I realize web developers are exceedingly intelligent and hardworking, but no one enjoys having to use two different tools for the same task. But that’s exactly what developers are being asked to do. To be a good developer, you have to be profiling your web site in multiple browsers. By definition, that means you have to install, learn, and update multiple tools. In addition, there are numerous quirks to keep in mind when going from one tool to another. And the features offered are not consistent across tools. It’s a real challenge to verify that your web app performs well across the major browsers. When pressed, rock star web developers I ask admit they only use one or two profilers – it’s just too hard to stay on top of a separate tool for each browser.
This week at Add-on-Con, Doug Crockford’s closing keynote is about the Future of the Web Browser. He’s assembled a panel of representatives from Chrome, Opera, Firefox, and IE. (Safari declined to attend.) My hope is they’ll discuss the need for a cross-browser extension model. There’s been progress in building protocols to support remote debugging: WebDebugProtocol and Crossfire in Firefox, Scope in Opera, and ChromeDevTools in Chrome. My hope for 2010 is that we see cross-browser convergence on standards for extensions and remote debugging, so that developers will have a slightly easier path for ensuring their apps are high performance on all browsers.

Scott Schiller | 10-Dec-09 at 10:00 am | Permalink |
Yep, this is good stuff; nice to see parse, reflow and JS timing all included in detail. Digging into the data and optimizing will take a bit of detective work, but the more people care about making efficient code, so much the better.
Wim Leers | 10-Dec-09 at 10:03 am | Permalink |
I don’t have the time to read the entire post at the moment, but: 1) WOW, 2) Google has indeed been kicking web performance ass as of lately!
HB | 10-Dec-09 at 11:16 am | Permalink |
I was already excited about this when I saw it on Google’s blog yesterday – thanks for the more detailed look! Agreed that an overall page pie chart would come in handy for quickly spotting possible problem areas.
Normally I use Firebug with YSlow for analyzing performance, component size and caching, tracking headers, etc. I have Page Speed for Firebug installed but haven’t found it as overall useful as YSlow. This, however, will definitely get me opening Chrome during optimization.
Stoyan | 10-Dec-09 at 12:13 pm | Permalink |
That’s great stuff!
I think you forgot to mention SPDY in the list of cool performance stuff from Google lately :)
Steve Souders | 10-Dec-09 at 12:49 pm | Permalink |
@Stoyan: The SPDY announcement was a few weeks ago, but certainly has the potential to be the most impactful performance announcement from Google.
Kyle Simpson | 11-Dec-09 at 2:21 am | Permalink |
When I run this on a test page (which loads just a sentence of text and 2 images (+ some invisible scripts in the background), I see the log include like 30 or 40 “paint”s, even though the page renders right away and basically doesn’t change. Any idea why that would be?
Elijah Lynn | 19-Dec-09 at 10:43 am | Permalink |
Yeah, Google is on FIRE!!!
And I am loving it!
Go Google!
Miller | 14-Jan-10 at 6:46 pm | Permalink |
Hi, I tried Speed Tracer this morning,but it seems work not well. Firstly,when switch to Network(resources), there is nothing there, but i did opened a website(map.google.com). Secondly,Sluggishness(events) seems include incompelte information, for example there is no Script Evaluation and DOMContentLoaded.
I have read the Gettting Started document many times but found nothing helpfull, could you tell me what’s the reason?
Thanks a lot!
By the way, my chrome version is “4.0.295.0 dev”,download from your suggest site and i do add the flag “–enable-extension-timeline-api”.
Paul Vincent | 16-Nov-10 at 1:09 am | Permalink |
Hi,
After I clicked the button to install Speed Tracer, where do i save the extension_0_18.crx to make it run with Chrome?
thanks,