Critical Metric: Critical Resources
A big change in the World of Performance for 2015 [this post is being cross-posted from the 2015 Performance Calendar] is the shift to metrics that do a better job of measuring the user experience. The performance industry grew up focusing on page load time, but teams with more advanced websites have started replacing PLT with metrics that have more to do with rendering and interactivity. The best examples of these new UX-focused metrics are Start Render and Speed Index.
Start Render and Speed Index
A fast start render time is important for a good user experience because once users request a new page, they’re left staring at the old page or, even worse, a blank screen. This is frustrating for users because nothing is happening and they don’t know if the site is down, if they should reload the page, or if they should simply wait longer. A fast start render time means the user doesn’t have to experience this frustration because she is reassured that the site is working and delivering upon her request.
Speed Index, a metric developed by Pat Meenan as part of WebPageTest, is the average time at which visible parts of the page are displayed. Whereas start render time captures when the rendering experience starts, Speed Index reflects how quickly the entire viewport renders. These metrics measure different things, but both focus on how quickly pages render which is critical for a good user experience.
Critical Resources
The main blockers to fast rendering are stylesheets and synchronous scripts. Stylesheets block all rendering in the page until they finish loading. Synchronous scripts (e.g., <script src="main.js">) block rendering for all following DOM elements. Therefore, synchronous scripts in the HEAD of the page block the entire page from rendering until they finish loading.
I call stylesheets and synchronous scripts “critical blocking resources†because of their big impact on rendering. A few months back I decided to start tracking this as a new performance metric as part of SpeedCurve and the HTTP Archive. Most performance services already have metrics for scripts and stylesheets, but a separate metric for critical resources is different in a few ways:
- It combines stylesheets and synchronous scripts into a single metric, making it easier to track their impact.
- It only counts synchronous scripts. Asynchronous scripts don’t block rendering so they’re not included. The HTTP Archive data for the world’s top 500K URLs shows that the median website has 10 synchronous scripts and 2 async scripts, so ignoring those async scripts gives a more accurate measurement of the impact on rendering. (I do this as a WebPageTest custom metric. The code is here.)
- Synchronous scripts loaded in iframes are not included because they don’t block rendering of the main page. (I’m still working on code to ignore stylesheets in iframes.)
Critical Metric
I’m confident this new “critical resources†metric will prove to be key for tracking a good user experience in terms of performance. Whether that’s true will be borne out as adoption grows and we gain more experience correlating this to other metrics that reflect a good user experience.
In the meantime, I added this metric to the HTTP Archive and measured the correlation to start render time, Speed Index, and page load time. Here are the results for the Dec 1 2015 crawl:
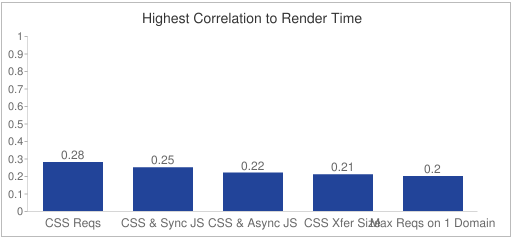
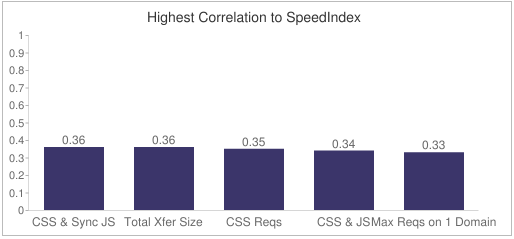

The critical resources metric described in this article is called “CSS & Sync JS†in the charts above. It has the highest correlation to Speed Index and the second highest correlation to start render time. This shows that “critical resources†is a good indicator of rendering performance. It doesn’t show up in the top five variables correlated to load time, which is fine. Most people agree that page load time is no longer a good metric because it doesn’t reflect the user experience.
We all want to create great, enjoyable user experiences. With the complexity of today’s web apps – preloading, lazy-loading, sync & async scripts, dynamic images, etc. – it’s important to have metrics that help us know when our user experience performance is slipping. Tracking critical resources provides an early indicator of how our code might affect the user experience, so we can keep our websites fast and our users happy.
Philip Tellis | 17-Feb-16 at 10:41 am | Permalink |
Hi Steve,
I’d like to redo this test with RUM data. I think we all agree that load time data from HTTP Archive is not reliable, so I think RUM might be better. The downside of course is that we don’t have a reliable measure for render time for RUM data, and we only have an approximate understanding of RUM SpeedIndex.
I also think the correlation here is fairly low. Anything below 0.5 suggests that there’s no correlation. Might be useful to compare different correlation algorithms, for example, Pearson v/s Spearman Ranked correlation to see if you get different results.
John | 17-Feb-16 at 1:51 pm | Permalink |
Steve,
Good post, and I agree that it is important to attempt to measure the user experience, however I believe this method has a flaw.
Synchronous scripts can be injected in the page and they might seem to block rendering when in fact they are not since they might be injected into the DOM after the fact. Also, even when there are scripts that block the rendering of something on the page, you can’t know for sure what is being blocked is critical to the business or the user. For example, I might have a script that is blocking a small image below the fold, and a user might not care about that. In those cases, I would be led to believe that the end-user’s perception was negative, when in fact it may have been positive.
John
Steve Souders | 17-Feb-16 at 5:30 pm | Permalink |
Philip: As you say, render time and Speed Index don’t exist or are unreliable for RUM. What would you correlate with? As for other correlations, all of the data is in HTTP Archive, so you could run those algorithms and any other analyses. (I know – we’re all busy. ;-)
John: Scripts injected into the DOM are actually marked as async. I tested that across all major browsers before rolling out this technique. Let me know if you found a counter example. It’s definitely possible that I didn’t test all scenarios. You are correct that the amount of content blocked by a script depends on where the script is placed. I mentioned that in the post (“block rendering for all following DOM elements”). There are some workarounds to that issue. I don’t want to reveal those at this time, but there’s a hint in the post if you re-read that paragraph. Finally, this article focuses on performance metrics that are selected regardless of the site being tested, but the best metrics are custom metrics. That’s the best way to address the problem you describe.
William | 22-Feb-16 at 11:31 am | Permalink |
This new metric seems useful. Where can I find it in Speed Curve? I don’t see it yet.
Steve Souders | 22-Feb-16 at 4:05 pm | Permalink |
Before releasing it in SpeedCurve we want to get at least a month or two of history for the timelines to look correct. It’ll be there soon.
Dean Hume | 24-Feb-16 at 1:30 am | Permalink |
Great post Steve!