How fast are we going now?
[This blog post is based on my keynote at the HTML5 Developer Conference. The slides are available on SlideShare and as PPTX.]
I enjoy evangelizing web performance because I enjoy things that are fast (and efficient). Apparently, I’m not the only one. Recent ad campaigns, especially for mobile, tout the virtues of being fast. Comcast uses the words “speed”, “fastest”, “high-speed”, and “lightning-fast” in the Xfinity ads. AT&T’s humorous set of commercials talks about how “faster is better“. iPhone’s new A6 chip is touted as “twice as fast“.
Consumers, as a result of these campaigns selling speed, have higher expectations for the performance of websites they visit. Multiple case studies support the conclusion that a faster website is better received by users and has a positive impact on the business’s bottom line:
- Bing found that searches that were 2 seconds slower resulted in a 4.3% drop in revenue per user.
- When Mozilla shaved 2.2 seconds off their landing page, Firefox downloads increased 15.4%.
- Shopzilla saw conversion rates increase 7-12% as a result of their web performance optimization efforts.
- Making Barack Obama’s website 60% faster increased donation conversions 14%.
Vendors are pitching a faster web. Consumers are expecting a faster web. Businesses succeed with a faster web. But is the Web getting faster? Let’s take a look.
Connection Speed
A key to a faster web experience is a faster Internet connection, but this aspect of web performance often feels like a black box. Users and developers are at the mercy of the ISPs and carrier networks. Luckily, data from Akamai’s State of the Internet shows that connection speeds are increasing.
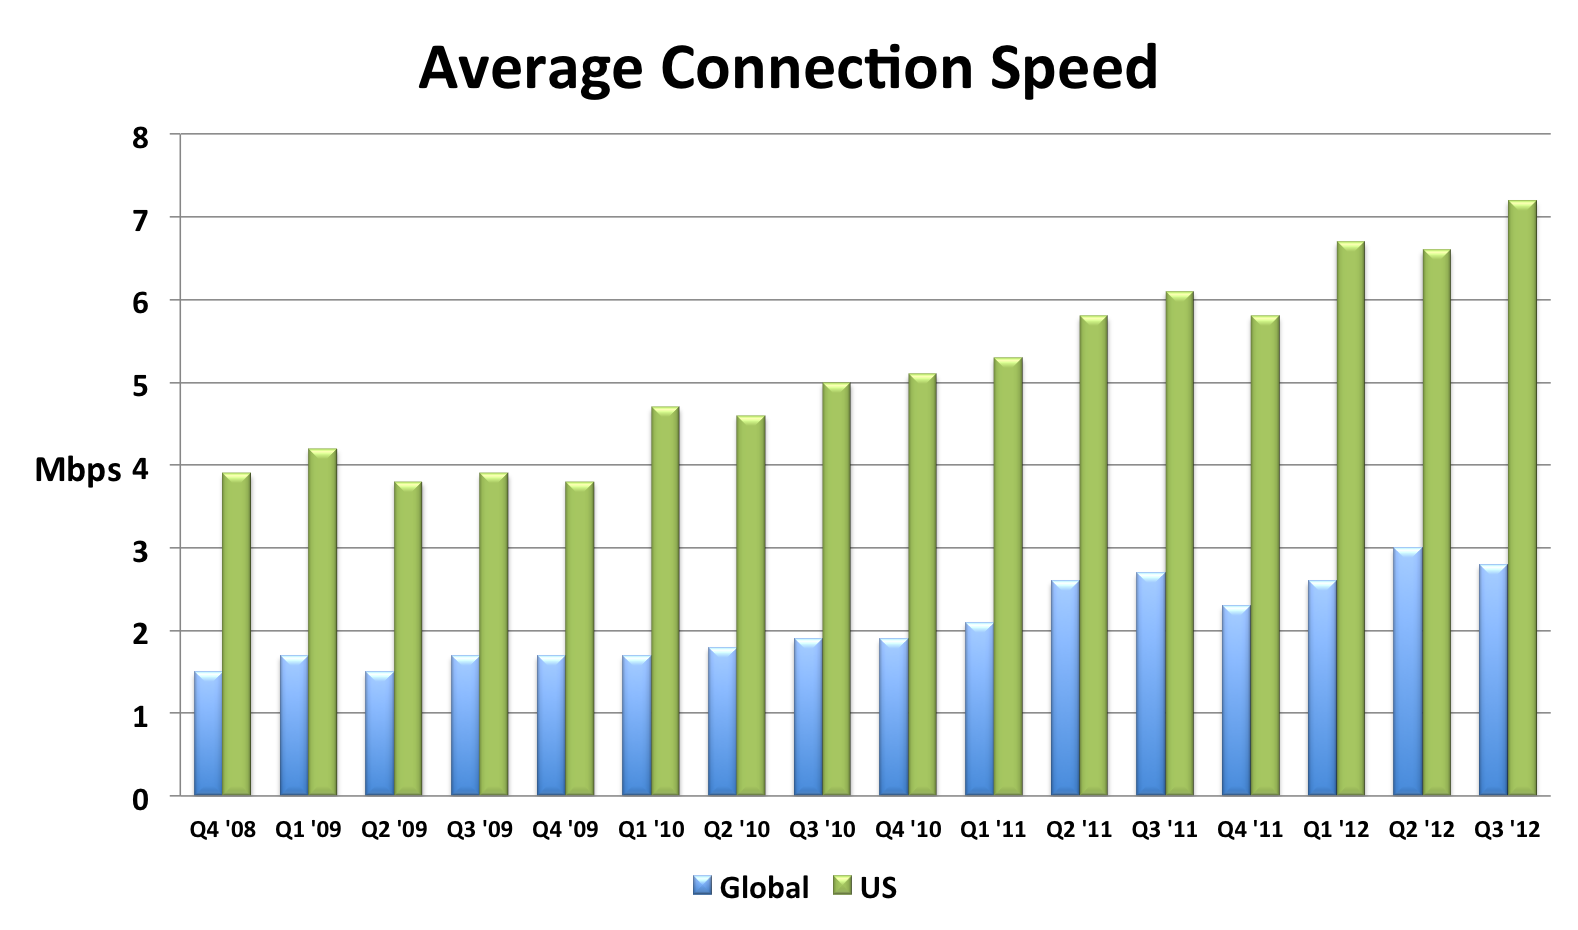
I compiled this chart by extracting the relevant data from each quarterly report. The chart shows that global connection speeds increased 4% and US connection speeds increased 18% over the most recent year that data exists (Q3 2011 to Q3 2012). I also created an Average Mobile Connection Speed chart which tracks three mobile carrier networks. Akamai masks the carrier network name but over the last year the connection speed of these mobile networks increased 30%, 68%, and 131%.
Browsers
Speed is a major feature for browsers. This focus has resulted in many performance improvements over the last few years. In my opinion browser improvements are the biggest contributor to a faster web. I’ll sidestep the contentious debate about which browser is fastest, and instead point out that, regardless of which one you choose, browsers are getting faster with each release.
The following chart shows page load times for major browsers as measured from real users. This report from Gomez is a bit dated (August 2011), but it’s the only real user data I’ve seen broken out by browser. Notice the trends for new releases – page load times improve 15-30%.

The other major benchmark for browsers is JavaScript performance. Below are charts from ZDNet’s browser benchmark report. Except for a regression in Firefox 18, all the trends are showing that browsers get faster with each release.


Page Weight
Web developers don’t have much control over connection speeds and browser optimizations, but they can control the size of their pages. Unfortunately, page weight continues to increase. The data below is from the HTTP Archive for the world’s top 1000 URLs. It shows that transfer size (number of bytes sent over the wire) increased 231K (28%) from March 2012 to March 2013. The biggest absolute increase was in images – growing 114K (23%). The biggest surprise, for me, was the growth in video by 62K (67%). This increase comes from two main factors: more sites are including video and the size of videos are increasing. Video performance is an area that we need to focus on going forward.
| Table 1. Transfer Size Year over Year | |||
| Mar 2012 | Mar 2013 | Δ | |
|---|---|---|---|
| total | 822 K | 1053 K | 231 K (28%) |
| images | 486 K | 600 K | 114 K (23%) |
| JS | 163 K | 188 K | 25 K (15%) |
| video | 92 K | 154 K | 62 K (67%) |
| HTML | 35 K | 42 K | 7 K (20%) |
| CSS | 30 K | 36 K | 6 K (20%) |
| font | 8 K | 18 K | 10 K (125%) |
| other | 8 K | 15 K | 7 K (88%) |
Quality of Craft
There are several “performance quality” metrics tracked in the HTTP Archive. Like page weight, these metrics are something that web developers have more control over. Unfortunately, these metrics were generally flat or trending down for the world’s top 1000 URLs. These metrics are hard to digest in bulk because sometimes higher is better, and other times it’s worse. There’s more detail below but the punchline is 5 of the 7 metrics got worse, and the other two were nearly flat.
| Table 2. Quality of Craft Metrics Year over Year | ||
| Mar 2012 | Mar 2013 | |
|---|---|---|
| PageSpeed Score | 82 | 84 |
| DOM Elements | 1215 | 1330 |
| # of Domains | 15 | 19 |
| Max Reqs on 1 Domain | 40 | 41 |
| Cacheable Resources | 62% | 60% |
| Compressed Responses | 76% | 77% |
| Pages w/ Redirects | 67% | 71% |
Here’s a description of each of these metrics and how they impact web performance.
- PageSpeed Score – PageSpeed is a performance “lint” analysis tool that generates a score from 0 to 100, where 100 is good. YSlow is a similar tool. Year over year the PageSpeed Score increased from 82 to 84, a (small) 2% improvement.
- DOM Elements – The number of DOM elements affects the complexity of a page and has a high correlation to page load times. The number of DOM elements increased from 1215 to 1330, meaning pages are getting more complex.
- # of Domains – The average number of domains per page increased from 15 to 19. More domains means there are more DNS lookups, which slows down the page. This is likely due to the increase in 3rd party content across the Web.
- Max Reqs on 1 Domain – The average top 1000 web page today has 100 requests spread across 19 domains. That averages out to ~5 requests per domain. But the distribution of requests across domains isn’t that even. The HTTP Archive counts how many requests are made for each domain, and then records the domain that has the maximum number of requests – that’s the “Max Reqs on 1 Domain” stat. This increased from 40 to 41. This is a bad trend for performance because most browsers only issue 6 requests in parallel, so it takes seven “rounds” to get through 41 requests. These sites would be better off adopting domain sharding.
- Cacheable Resources – Pages are faster if resources are read from cache, but that requires website owners to set the appropriate caching headers. This stat measures the percentage of requests that had a cache lifetime greater than zero. Unfortunately, the percentage of cacheable resources dropped from 62% to 60%.
- Compressed Responses – The transfer size of text responses (HTML, scripts, stylesheets, etc.) can be reduced ~70% by compressing them. It doesn’t make sense to compress binary data such as images and video. This stat shows the percentage of requests that should be compressed that actually were compressed. The number increased but just slightly from 76% to 77%.
- Pages with Redirects – Redirects slow down pages because an extra roundtrip has to be made to fetch the final response. The percentage of pages with at least one redirect increased from 67% to 71%.
These drops in performance quality metrics is especially depressing to me since evangelizing performance best practices is a large part of my work. It’s especially bad since this only looks at the top 1000 sites which typically have more resources to focus on performance.
User Experience
The ultimate goal isn’t to improve these metrics – it’s to improve the user experience. Unfortunately, we don’t have a way to measure that directly. The metric that’s used as a proxy for the user’s perception of website speed is “page load time” – the time from when the user initiates the request for the page to the time that window.onload fires. Many people, including myself, have pointed out that window.onload is becoming less representative of a web page’s perceived speed, but for now it’s the best we have.
Perhaps the largest repository of page load time data is in Google Analytics. In April 2013 the Google Analytics team published their second report on the speed of the web where they compare aggregate page load times to a year ago. The median page load time on desktops got ~3.5% faster, and on mobile was ~18%Â ~30% faster.

Scorecard
Web pages have gotten bigger. The adoption of performance best practices has been flat or trending down. Connection speeds and browsers have gotten faster. Overall, web pages are faster now than they were a year ago. I think browser vendors deserve most of the credit for this speed improvement. Going forward, web developers will continue to be pushed to add more content, especially 3rd party content, to their sites. Doing this in a way that follows performance best practices will help to make the Web even faster for next year.
Fibo | 09-May-13 at 1:02 am | Permalink |
On some pages, ads are creating some additionals delays that are out of developers’ control: redirects, slow-answers DNS, etc.
Even Google Analytics can create delays.
Not sure how/if it is possible to carry a study of this part only, but surely some good/ bad practices over this would useful for advertisers as well as their vectors
Jeremy Zawony | 09-May-13 at 6:26 pm | Permalink |
What about latency? All the bandwidth in the world won’t make some classes of services/apps feel “fast” if you’re dealing with 100+ ms latency.
Do you know of any services that track that for the major wired and wireless providers?
Steve Souders | 10-May-13 at 9:36 am | Permalink |
Fibo: Several years ago I encouraged the IAB to look at the performance of ads. They have the Ad Load Performance working group that has published best practices for ads. So, to your question about best practices – those exist. The part that’s important and missing is monitoring of ad performance – that doesn’t exist today which is unfortunate.
Jeremy: Hi! As you mention, latency has a dramatic impact on performance for people with very fast connections (5+ mbps). Latency is also important for people on slower connections, but a faster connection actually has a bigger performance improvement than reducing latency. As shown in the Akamai chart, connection speeds in the US are getting fast enough that latency is an important metric to track. I’m not aware of any stats on latency for different carriers and ISPs. I bet they exist. Maybe another reader has pointers?
Matt C | 10-May-13 at 2:24 pm | Permalink |
Steve:
Not sure if this is what you are looking for but Keynote does have the latency listed for ISPISP in semi-realtime. There are lots of other questions that come up when looking that data like connection speeds- but a Keynote representative or engineer might be able to shine more light on the details.
http://www.internethealthreport.com/
Aji(CEO, Techshu.com) | 11-May-13 at 12:26 am | Permalink |
When we started coding for a free web analytics in 2004 (to understand click fraud from Adwords traffic), the challenges were different. Now the options are plenty but there is a big divide, SMEs don’t understand the important of speed and can’t afford custom solution, they need a ready made solution which will take care of it. We are working towards a system using drupal that can load within 2 secs flat … really fast … and at a cost which is feasible.
Dave | 11-Jun-13 at 12:17 pm | Permalink |
When discussing page load time under user experience, does the mobile load time refer to normal or typical websites designed for a desktop loading on a mobile device or specifically designed sites that redirect to a mobile version?
Steve Souders | 11-Jun-13 at 6:34 pm | Permalink |
Dave: The mobile load times are based on all websites visited from a mobile device – so it includes whatever type of page the website owner is providing to the device.
Parminder Chahal | 23-Jun-13 at 8:02 pm | Permalink |
@Jeremy Zawony
You guys in USA and Europe call 100ms+ latency excessive and us lot here in India call anything below 300ms to be a lottery win. I am not exaggerating. I am myself on a 3G connection and any server in USA would take 350ms+ and European locations little less then 300. I recently moved one of my websites to an Indian data Centre and that is about 50kms from my place and guess what? I still get 120ms.
Majority in this country is on wireless internet connections and latency sucks. Local hosting Industry is almost nonexistent. 150ms latency sounds like a dream come true ;)
Brad Canham | 26-Jul-13 at 12:27 pm | Permalink |
Steve; “The part that’s important and missing is monitoring of ad performance – that doesn’t exist today which is unfortunate.” Not sure if there is something I’m missing here, but monitoring and trending of ad performance (and any 3rd party hosted element) is part of external browser-based monitoring service (including ours). Are you referring to some kind of industry-wide report on the state of ad performance?