do u webview?
A “webview” is a browser bundled inside of a mobile application producing what is called a hybrid app. Using a webview allows mobile apps to be built using Web technologies (HTML, JavaScript, CSS, etc.) but still package it as a native app and put it in the app store. In addition to allowing devs to work with familiar technologies, other advantages of building a hybrid app include greater code reuse across the app and the website, and easier support for multiple mobile platforms.
We all have webview traffic
Deciding whether to build a hybrid app versus a native app, or to have an app at all, is a lengthy debate and not the point of this post. Even if you don’t have a hybrid app, a significant amount of your mobile traffic comes from webviews. That’s because many sources of traffic are hybrid apps. Two examples on iOS are the Facebook app and Google Chrome. “Whoa, whoa, whoa” you say, Facebook’s retreat from its hybrid app is well known. That’s true. The Facebook timeline, for example, is no longer rendered using a webview:

However, the Facebook timeline contains links, such as the link to http://www.guggenheim.org/ in the timeline above. When users click on links in the timeline, the Facebook app opens those in a webview:

Similarly, Chrome for iOS is implemented using a webview. Across all iOS traffic, 6% comes from Facebook’s webview and 5% comes from Google Chrome according to ScientiaMobile. And there are other examples: Twitter’s iOS app uses a webview to render clicked links, etc.
I encourage you to scan your server logs to gauge how much of your mobile traffic comes from webviews. There’s not much documentation on webview User-Agent strings. For iOS, the User-Agent is typically a base string with information appended by the app. Here’s the User-Agent string for Facebook’s webview:
Mozilla/5.0 (iPhone; CPU iPhone OS 7_1_1 like Mac OS X) AppleWebKit/537.51.2 (KHTML, like Gecko) Mobile/11D201 [FBAN/FBIOS;FBAV/12.1.0.24.20; FBBV/3214247; FBDV/iPhone6,1;FBMD/iPhone; FBSN/iPhone OS;FBSV/7.1.1; FBSS/2; FBCR/AT&T;FBID/phone;FBLC/en_US;FBOP/5]
Here’s the User-Agent string from Chrome for iOS:
Mozilla/5.0 (iPhone; CPU iPhone OS 7_1_2 like Mac OS X) AppleWebKit/537.51.2 (KHTML, like Gecko) CriOS/37.0.2062.60 Mobile/11D257 Safari/9537.53
That’s a lot of detail. The bottom line is: we’re all getting more webview traffic than we expect. Therefore, it’s important that we understand how webviews perform and take that into consideration when building our mobile websites.
Webview performance
Since a webview is just a bundled browser, we might think that webviews and their mobile browser counterpart have similar performance profiles. It turns out that this is not the case. This was discovered as an unintentional side effect from the article iPhone vs. Android – 45,000 Tests Prove Who is Faster. This article from 2011, in the days of iOS 4.3, noted that the iPhone browser was 52% slower than Android’s. The results were so dramatic it triggered the following response from Apple:
[Blaze’s] testing is flawed. They didn’t actually test the Safari browser on the iPhone. Instead they only tested their own proprietary app, which uses an embedded Web viewer that doesn’t actually take advantage of Safari’s Web performance optimizations.
Apple’s response is accurate. The study conducted by Blaze (now part of Akamai) was conducted using a webview, so it was not a true comparison of the mobile browser from each platform. But the more important revelation is that webviews were hobbled resulting in worse performance than mobile Safari. Specifically, the webview on iOS 4.3 did not have Nitro’s JIT compiler for JavaScript, application cache, nor asynchronous script loading.
This means it’s not enough to track the performance of mobile browsers alone; we also need to track the performance of webviews. This is especially true in light of the fact that more than 10% of iOS traffic comes from webviews. Luckily, the state of webviews is better than it was in 2011. Even better, the most recent webviews have significantly more features when it comes to performance. The following table compares the most recent iOS and Android webviews along a set of important performance features.
| iOS 7 UIWebView |
iOS 8 WKWebView |
Android 4.3 Webkit Webview |
Android 4.4 Chromium Webview |
|
|---|---|---|---|---|
| Nitro/V8 | ✔ | ✔ | ||
| html5test.com | 410 | 440 | 278 | 434 |
| localStorage | ✔ | ✔ | ✔ | ✔ |
| app cache | ✔ | ✔ | ✔ | ✔ |
| indexedDB | ✔ | ✔ | ||
| SPDY | ✔ | ✔ | ||
| WebP | ✔ | |||
| srcset | ✔ | ? | ||
| WebGL | ✔ | ? | ||
| requestAnimation- Frame | ✔ | ✔ | ✔ | |
| Nav Timing | ✔ | ✔ | ✔ | |
| Resource Timing | ✔ |
As shown in this table, the newest webviews have dramatically better performance. The most important improvement is JIT compilation for JavaScript. While localStorage and app cache now have support across all webviews, the newer webviews add support for indexedDB. Support for SPDY in the newer webviews is important to help mitigate the impact of slow mobile networks. WebP, image srcset, and WebGL address the bloat of mobile images, but support for these features is mixed. (I wasn’t able to confirm the status of srcset and WebGL in Android 4.4’s webview. Please add comments and I’ll update the table.) The requestAnimationFrame API gives smoother animations. Finally, adoption of the Nav Timing and Resource Timing APIs gives website owners the ability to track performance for websites served inside webviews.
Not out of the woods yet
While the newest webviews have a better performance profile, we’re still on the hook for supporting older webviews. Hybrid apps will continue to use the older webviews until they’re rebuilt and updated. The Android webview is pinned at Chromium 30 and requires an OS upgrade to get feature updates. Similar to the issues with legacy browsers, traffic from legacy webviews will continue for at least a year. Given the significant amount of traffic from webviews and the dramatic differences in webview performance, it’s important that developers measure performance on old and new webviews, and apply mobile performance best practices to make their website as fast as possible even on old webviews.
(Many thanks to Maximiliano Firtman, Tim Kadlec, Brian LeRoux, and Guy Podjarny for providing information for this post.)
Onload in Onload
or “Why you should use document.readyState”
I asked several web devs what happens if an onload handler adds another onload handler. Does the second onload handler execute?
The onload event has already fired, so it might be too late for the second onload to get triggered. On the other hand, the onload phase isn’t over (we’re between loadEventStart and loadEventEnd in Navigation Timing terms), so there might be a chance the second onload handler could be added to a queue and executed at the end.
None of the people I asked knew the answer, but we all had a guess. I’ll explain in a minute why this is important, but until then settle on your answer – do you think the second onload executes?
To answer this question I created the Onload in Onload test page. It sets an initial onload handler. In that first onload handler a second onload handler is added. Here’s the code:
function addOnload(callback) {
    if ( "undefined" != typeof(window.attachEvent) ) {
        return window.attachEvent("onload", callback);
    }
    else if ( window.addEventListener ){
        return window.addEventListener("load", callback, false);
    }
}

function onload1() {
    document.getElementById('results').innerHTML += "First onload executed.";
    addOnload(onload2);
}

function onload2() {
    document.getElementById('results').innerHTML += "Second onload executed.";
}

addOnload(onload1);
I created a Browserscope user test to record the results and tweeted asking people to run the test. Thanks to crowdsourcing we have results from dozens of browsers. So far no browser executes the second onload handler.
Why is this important?
There’s increasing awareness of the negative impact scripts have on page load times. Many websites are following the performance best practice of loading scripts asynchronously. While this is a fantastic change that makes pages render more quickly, it’s still possible for an asynchronous script to make pages slower because onload doesn’t fire until all asynchronous scripts are done downloading and executing.
To further mitigate the negative performance impact of scripts, some websites have moved to loading scripts in an onload handler. The problem is that often the scripts being moved to the onload handler are third party scripts. Combine this with the fact that many third party scripts, especially metrics, kickoff their execution via an onload handler. The end result is we’re loading scripts that include an onload handler in an onload handler. We know from the test results above that this results in the second onload handler not being executed, which means the third party script won’t complete all of its functionality.
Scripts (especially third party scripts) that use onload handlers should therefore check if the onload event has already fired. If it has, then rather than using an onload handler, the script execution should start immediately. A good example of this is my Episodes RUM library. Previously I initiated gathering of the RUM metrics via an onload handler, but now episodes.js also checks document.readyState to ensure the metrics are gathered even if onload has already fired. Here’s the code:
    if ( "complete" == document.readyState ) {
        // The page is ALREADY loaded - start EPISODES right now.
        if ( EPISODES.autorun ) {
            EPISODES.done();
        }
    }
    else {
        // Start EPISODES on onload.
        EPISODES.addEventListener("load", EPISODES.onload, false);
    }
Summing up:
- If you own a website and want to make absolutely certain a script doesn’t impact page load times, consider loading the script in an onload handler. If you do this, make sure to test that the delayed script doesn’t rely on an onload handler to complete its functionality. (Another option is to load the script in an iframe, but third party scripts may not perform correctly from within an iframe.)
- If you own a third party script that adds an onload handler, you might want to augment that by checkingÂ
document.readyState to make sure onload hasn’t already fired.
Velocity highlights (video bonus!)
We’re in the quiet period between Velocity Santa Clara and Velocity New York. It’s a good time to look back at what we saw and look forward to what we’ll see this September 15-17 in NYC.
Velocity Santa Clara was our biggest show to date. There was more activity across the attendees, exhibitors, and sponsors than I’d experienced at any previous Velocity. A primary measure of Velocity is the quality of the speakers. As always, the keynotes were livestreamed. The people who tuned in were not disappointed. I recommend reviewing all of the keynotes from the Velocity YouTube Playlist. All of them were great, but here were some of my favorites:
 |
Virtual Machines, JavaScript and Assembler – Start. Here. Scott Hanselman’s walk through the evolution of the Web and cloud computing is informative and hilarious. |
 |
Lowering the Barrier to Programming – Pamela Fox works on the computer programming curriculum at Khan Academy. She also devotes time to Girl Develop It. This puts her in a good position to speak about the growing gap between the number of programmers and the number of programmer jobs, and how bringing more diversity into programming is necessary to close this gap. |
 |
Achieving Rapid Response Times in Large Online Services – Jeff Dean, Senior Fellow at Google, shares amazing techniques developed at Google for fast, scalable web services. |
 |
Mobile Web at Etsy – People who know Lara Swanson know the incredible work she’s done at Etsy building out their mobile platform. But it’s not all about technology. For a company to be successful it’s important to get cultural buy-in. Lara explains how Etsy achieved both the cultural and technical advances to tackle the challenges of mobile. |
 |
Build on a Bedrock of Failure – I want to end with this motivational cross-disciplinary talk from skateboarding icon Rodney Mullen. When you’re on the bleeding edge (such as skateboarding or devops), dealing with failure is a critical skill. Rodney talks about why people put themselves in this position, how they recover, and what they go on to achieve. |
Now for the bonus! Some speakers have posted the videos of their afternoon sessions. These are longer, deeper talks on various topics. Luckily, some of the best sessions are available on YouTube:
 |
Is TLS Fast Yet? – If you know performance then you know Ilya Grigorik. And if you know SPDY, HTTP/2, privacy, and security you know TLS is important. Here, the author of High Performance Browser Networking talks about how fast TLS is and what we can do to make it faster. |
 |
GPU and Web UI Performance: Building an Endless 60fps Scroller – Whoa! Whoa whoa whoa! Math?! You might not have signed up for it, but Diego Ferreiro takes us through the math and physics for smooth scrolling at 60 frames-per-second and his launch of ScrollerJS. |
 |
WebPagetest Power Users Part 1 and Part 2 – WebPagetest is one of the best performance tools out there. Pat Meenan, creator of WebPagetest, guides us through the new and advanced features. |
 |
Smooth Animation on Mobile Web, From Kinetic Scrolling to Cover Flow Effect – Ariya Hidayat does a deep dive into the best practices for smooth scrolling on mobile. |
 |
Encouraging Girls in IT: A How To Guide -Â Doug Ireton and his 7-year-old daughter, Jane Ireton, lament the lack of women represented in computer science and Jane’s adventure learning programming. |
If you enjoy catching up using video, I recommend you watch these and other videos from the playlist. If you’re more of the “in-person” type, then I recommend you register for Velocity New York now. While you’re there, use my STEVE25 discount code for 25% off. I hope to see you in New York!
HTTP Archive – new stuff!
Background
The HTTP Archive crawls the world’s top 300K URLs twice each month and records detailed information like the number of HTTP requests, the most popular image formats, and the use of gzip compression. We also crawl the top 5K URLs on real iPhones as part of the HTTP Archive Mobile. In addition to aggregate stats, the HTTP Archive has the same set of data for individual websites plus images and video of the site loading.
I started the project in 2010 and merged it into the Internet Archive in 2011. The data is collected using WebPagetest. The code and data are open source. The hardware, mobile devices, storage, and bandwidth are funded by our generous sponsors:  Google, Mozilla, New Relic, O’Reilly Media, Etsy, Radware, dynaTrace Software, Torbit, Instart Logic, and Catchpoint Systems.
For more information about the HTTP Archive see our About page.
New Stuff!
I’ve made a lot of progress on the HTTP Archive in the last two months and want to share the news in this blog post.
- Github
- A major change was moving the code to Github. It used to be on Google Code but Github is more popular now. There have been several contributors over the years, but I hope the move to Github increases the number of patches contributed to the project.
- Histograms
- The HTTP Archive’s trending charts show the average value of various stats over time. These are great for spotting performance regressions and other changes in the Web. But often it’s important to look beyond the average and see more detail about the distribution. As of today all the relevant trending charts have a corresponding histogram. For an example, take a look at the trending chart for Total Transfer Size & Total Requests and its corresponding histograms. I’d appreciate feedback on these histograms. In some cases I wonder if a CDF would be more appropriate.
- Connections
- We now plot the number of TCP connections that were used to load the website. (All desktop stats are gathered using IE9.) Currently the average is 37 connections per page.
 Â
 - CDNs
- We now record the CDN, if any, for each individual resource. This is currently visible in the CDNs section for individual websites. The determination is based on a reverse lookup of the IP address and a host-to-CDN mapping in WebPagetest.
Custom Metrics
Pat Meenan, the creator of WebPagetest, just added a new feature called custom metrics for gathering additional metrics using JavaScript. The HTTP Archive uses this feature to gather these additional stats:
- Average DOM Depth
- The complexity of the DOM hierarchy affects JavaScript, CSS, and rendering performance. I first saw average DOM depth as a performance metric in DOM Monster. I think it’s a good stat for tracking DOM complexity.
 Â
 - Document Height
- Web pages are growing in many ways such as total size and use of fonts. I’ve noticed pages also getting wider and taller so HTTP Archive now tracks document height and width. You can see the code here. Document width is more constrained by the viewport of the test agent and the results aren’t that interesting, so I only show document height.
 Â
 - localStorage & sessionStorage
- The use of localStorage and sessionStorage can help performance and offline apps, so the HTTP Archive tracks both of these. Right now the 95th percentile is under 200 characters for both, but watch these charts over the next year. I expect we’ll see some growth.
- Iframes
- Iframes are used frequently to contain third party content. This will be another good trend to watch.

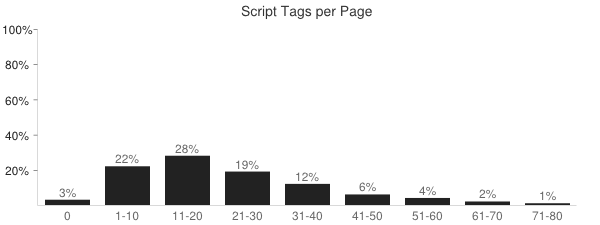
- SCRIPT Tags
- The HTTP Archive has tracked the number of external scripts since its inception, but custom metrics allows us to track the total number of SCRIPT tags (inline and external) in the page.
- Doctype
- Specifying a doctype affects quirks mode and other behavior of the page. Based on the latest crawl, 14% of websites don’t specify a doctype, and “html” is the most popular doctype at 40%. Here are the top five doctypes.
Doctype Percentage html40% html -//W3C//DTD XHTML 1.0 Transitional//EN http://www.w3.org/TR/xhtml1/DTD/xhtml1-transitional.dtd31% [none] 14% html -//W3C//DTD XHTML 1.0 Strict//EN http://www.w3.org/TR/xhtml1/DTD/xhtml1-strict.dtd8% HTML -//W3C//DTD HTML 4.01 Transitional//EN http://www.w3.org/TR/html4/loose.dtd3%
Some of these new metrics are not yet available in the HTTP Archive Mobile but we’re working to add those soon. They’re available as histograms currently, but once we have a few months of data I’ll add trending charts, as well.
What’s next?
Big ticket items on the HTTP Archive TODO list include:
- easier private instance – I estimate there are 20 private instances of HTTP Archive out there today (see here, here, here, here, and here). I applaud these folks because the code and documentation don’t make it easy to setup a private instance. There are thousands of WebPagetest private instances in the world. I feel that anyone running WebPagetest on a regular basis would benefit from storing and viewing the results in HTTP Archive. I’d like to lower the bar to make this happen.
- 1,000,000 URLs – We’ve increased from 1K URLs at the beginning four years ago to 300K URLs today. I’d like to increase that to 1 million URLs on desktop. I also want to increase the coverage on mobile, but that’s going to probably require switching to emulators.
- UI overhaul – The UI needs an update, especially the charts.
In the meantime, I encourage you to take a look at the HTTP Archive. Search for your website to see its performance history. If it’s not there (because it’s not in the top 300K) then add your website to the crawl. And if you have your own questions you’d like answered then try using the HTTP Archive dumps that Ilya Grigorik has exported to Google BigQuery and the examples from bigqueri.es.
MySQL dumps
As part of the HTTP Archive project, I create MySQL dumps for each crawl (on the 1st and 15th of each month). You can access the list of dumps from the downloads page. Several people use these dumps, most notably Ilya Grigorik who imports the data into Google BigQuery.
For the last year I’ve hesitated on many feature requests because they require schema changes. I wasn’t sure how changing the schema would affect the use of the dump files that preceded the change. This blog post summarizes my findings.
Format
When I started the HTTP Archive all the dumps were exported in MySQL format using a command like the following:
mysqldump --opt --skip-add-drop-table -u USERNAME -p -h SERVER DBNAME TABLENAME | gzip > TABLENAME.gz
These MySQL formatted dump files are imported like this:
gunzip -c TABLENAME.gz | mysql -u USERNAME -p -h SERVER DBNAME
People using databases other than MySQL requested that I also export in CSV format. The output of this export command is two files: TABLENAME.txt and TABLENAME.sql. The .txt file is CSV formatted and can be gzipped with a separate command.
mysqldump --opt --complete-insert --skip-add-drop-table -u USERNAME -p -h SERVER -T DIR DBNAME TABLENAME
gzip -c DIR/TABLENAME.txt > DIR/TABLENAME.csv.gz
This CSV dump is imported like this:
gunzip DIR/TABLENAME.csv.gz
mysqlimport --local --fields-optionally-enclosed-by="\"" --fields-terminated-by=, --user=USERNAME -p DBNAME DIR/TABLENAME.csv
The largest HTTP Archive dump file is ~25G unzipped and ~3G gzipped. This highlights a disadvantage of using CSV formatted dumps: there’s no way to gzip and ungzip in memory. This is because the mysqlimport command uses the filename to determine which table to use – if you piped in the rows then it wouldn’t know the table name. Unzipping a 25G file can be a challenge if disk space is limited.
On the other hand, the CSV import is ~30% faster than using the MySQL format file. This can save over an hour when importing 30 million rows. The HTTP Archive currently provides dumps in both MySQL and CVS format so people can choose between less disk space or faster imports.
Forward Compatibility
My primary concern is with the flexibility of previously-generated dump files in light of later schema changes – namely adding and dropping columns.
Dump files in MySQL format work fine with added columns. The INSERT commands in the dump are tied to specific column names, so the new columns are simply ignored. CSV formatted dumps are less flexible. The values in a row are stuffed into the table’s columns in order. If a new column is added at the end, everything works fine. But if a column is added in the middle of the existing columns, the row values will all shift one column to the left.
Neither format works well with dropped columns. MySQL formatted files will fail with an “unknown column” error. CSV formatted files will work but all the columns will be shifted, this time to the right.
Takeaways
I now feel comfortable making schema changes without invalidating the existing dump files provided I follow these guidelines:
- don’t drop columns – If a column is no longer needed, I’ll leave it in place and modify the column definition to be a small size.
- add columns at the end – I prefer to organize my columns semantically, but all new columns from this point forward will be added at the end.
I’ll continue to create dumps in MySQL and CSV format. These guidelines ensure that all past and future dump files will work against the latest schema.
Unexpected prerender in Chrome
Over the last week I’ve been investigating the cacheability of resources from Shopify. I would visit the page every few hours and track the number of 200 OK versus 304 Not Modified responses. To my surprise, Chrome’s Network tab indicated that almost all the responses were “from cache”.
This didn’t make sense. In many cases the resource URLs changed between test loads. How could a never-before-seen URL be “from cache”? In cases where the URL was the same, I noticed that the Date response header had changed from the previous test but Chrome still marked it “from cache”. How could the Date change without a 200 response status code?
I started thinking about my “Prebrowsing” work (blog post, slides, video). In my findings I talk about how browsers, especially Chrome, are doing more work in anticipation of what the user needs next. This proactive work includes doing DNS lookups, establishing TCP connections, downloading resources, and even prerendering entire pages.
Was it possible that Chrome was prerendering the entire page?
I started by looking at chrome://predictors. Given characters entered into Omnibox (the location field), this shows which URL you’re predicted to go to. In my tests, I had always typed the URL into the location bar, so the predictions for “shopify” could affect Chrome’s behavior in my tests. Here’s what I found in chrome://predictors:

Chrome predicted that if I entered “www.s” into the Omnibox I would end up going to “http://www.shopify.com/” with confidence 1.0 (as shown in the rightmost column). In fact, just typing “ww” had a 0.9 confidence of ending up on Shopify. In other words, Chrome had developed a deep history mapping my Omnibox keystrokes to the Shopify website, as indicated by rows colored green.
From my Prebrowsing research I knew that if the chrome://predictors confidence was high enough, Chrome would pre-resolve DNS and pre-connect TCP. Perhaps it was possible that Chrome was also proactively sending HTTP requests before they were actually needed. To answer this I opened Chrome’s Net panel and typed “www.s” in the Omnibox but never hit return. Instead, I just sat there and waited 10 seconds. But nothing showed up in Chrome’s Net panel:

Suspecting that these background requests might not show up in Net panel, I fired up tcpdump and repeated the test – again only typing “www.s” and NOT hitting return. I uploaded the pcap file to CloudShark and saw 86 HTTP requests!

I looked at individual requests and saw that they were new URLs that had never been seen before but were in the HTML document. This confirmed that Chrome was prerendering the HTML document (as opposed to prefetching individual resources based on prior history). I was surprised that no one had discovered this before, so I went back to High Performance Networking in Google Chrome by Ilya Grigorik and scanned the Omnibox section:
the yellow and green colors for the likely candidates are also important signals for the ResourceDispatcher! If we have a likely candidate (yellow), Chrome may trigger a DNS pre-fetch for the target host. If we have a high confidence candidate (green), then Chrome may also trigger a TCP pre-connect once the hostname has been resolved. And finally, if both complete while the user is still deliberating, then Chrome may even pre-render the entire page in a hidden tab.
Takeaways
What started off as a quick performance analysis turned into a multi-day puzzler. The puzzle’s solution yields a few takeaways:
- Remember that Chrome may do DNS prefetch, TCP pre-connect, and even prerender the entire page based on the confidences in chrome://predictors.
- Not all HTTP requests related to a page or tab are shown in Chrome’s Net panel. I’d like to see this fixed, perhaps with an option to show these behind-the-scenes requests.
- Ilya knows everything. Re-read his posts, articles, and book before running multi-day experiments.
fast, faster, Fastly
Today I join Fastly as Chief Performance Officer. Read more in Fastly’s announcement.
I’m excited to get back to the world of startups. People who have known me for less than 15 years don’t know that side of me. In my early career I worked at Advanced Decision Systems, Helix Systems (co-founder), General Magic, WhoWhere?, and CoolSync (co-founder) – companies that ranged from 3 to 300 employees.
I went to Yahoo! with the intention of staying for a few years to have some good healthcare. I loved it so much I stayed for eight years working with people like Doug Crockford, Stoyan Stefanov, Nicholas Zakas, Nicole Sullivan, Tenni Thuerer, and Philip Tellis and many more incredible developers. It was there that Ash Patel and Geoff Ralston asked me to start a team focused on performance. As visionary executives, they believed there was a set of performance best practices that would be applicable to all the Yahoo! properties. It turned out those best practices apply to nearly every site on the Web.
Knowing Google’s culture of performance I was excited to continue my work there over the past six years. Google is an amazing company. I want to loudly thank Yahoo! and Google for giving me the opportunity to focus on web performance. They are responsible for sharing this web performance research, tools, and code with the web community. It’s important that we have companies like these to move the Web forward.
Many of Google’s performance projects, such as Chrome, SPDY, WebP, and Public DNS, focus on improving the Web’s infrastructure. These infrastructure projects have a dramatic impact – they help raise the tide for all websites. That’s half of the equation. The other half lies with how websites are built. Even on this fast infrastructure it’s still possible to build a slow website.
That’s why I’m excited to join Fastly where I’ll be able to engage with Fastly’s customers to produce websites that are blazingly fast. Fastly’s CDN platform is built with latest generation technology and software. I hope to add more performance to an already fast network, and make it go even fastlier.
Browser Wishlist 2013
This is a cross-post from last month’s Performance Calendar (hence the reference to “holiday” spirit).
In case any browser teams are awash in the spirit of holiday gift-giving, here’s my wishlist for performance features I’d love to see. I did a similar Browser Performance Wishlist in 2010. I hope this list will initiate numerous discussions that result in a faster browsing experience for everyone.
- async 3rd party content (especially ads)
The amount of 3rd party content on websites continues to grow.* Websites need a way to load this content without having it delay the 1st party content on the page. Iframes are a possible solution, but there are various issues including fixed sizing. Many 3rd party content providers provide async snippets, but this is the exception rather than the rule.
Perhaps the most popular 3rd party content on the Web is ads, where asynchronous snippets are almost unheard of. Asynchronous loading is more complex for ads because they often use document.write. We need a way to load 3rd party content, including ads, asynchronously even when there’s a possibility of document.write being used. HTML imports are a possible solution depending on the final implementation and the need for workarounds.
* This is based on data such as the 50% increase in the number of domains per page and the increase in estimated amount of third party content from 32% to 38% over the previous two years. It would be great if someone used the HTTP Archive data to more precisely quantify this. The hard part is defining “3rd party content” in SQL.
- async document.write
Another approach to enable loading scripts asynchronously would be if browsers supported an async version of document.write. Currently, if document.write occurs in an asynchronous script the best case is the document.write is ignored. The worst case is the entire page is erased and replaced with just the output from document.write. (See this test page.)
It would be better if browsers instead inserted the output from document.write right below the associated SCRIPT tag. The implementation is much more complex that I make it sound. In fact, Opera used to have a Delayed Script Execution option that was able to do this but it’s no longer available.
- Preferred Caching
There’s a long tail to Internet browsing, but users also have favorite websites that they visit every day. To increase the probability of those sites loading faster, browsers should more aggressively cache the resources associated with these favorite websites. Websites could be deemed “favorite” manually by the user as well as automatically based on browsing history. (See related blog post.)
- Prefresh
“Prefresh” is a concept Tony Gentilcore and I came up with to make websites load faster by proactively downloading and updating critical resources before they’re needed. The determination of what to prefresh is based on prior activity. This is currently an experimental feature in Chrome. (See related blog post.) I’d like to see the code finished in Chrome and, based on results, adopted by other browsers.
- responsive images (Client Hints)
Responsive images is a complex issue with multiple candidate solutions. (See Bruce Lawson’s Responsive images – end of year report.) All of the proposals have pros and cons. The issue has been discussed for more than a year. It’s important for browsers to pick the preferred solution. I wish Client Hints was supported. It doesn’t solve all the problems, but I think it’s a lightweight solution that works in most cases, especially since CDNs can automate the process for website owners.
- more RUM (rendering, fps, GC, etc.)
The W3C Web Performance Working Group has made incredible progress with the Navigation Timing, Resource Timing, and User Timing specifications. (Except on Safari as mentioned earlier.) These APIs allow us to measure performance where it matters the most: on real users. But the performance we’re able to measure is more about the mechanics of the page and less about the user experience and what’s going on behind the scenes.
I’d like JavaScript access to information about rendering, garbage collection, frames per second, memory use, and JavaScript execution. Much of this is available today in browser dev tools. The big work seems to be defining what to measure in a way that can be standardized across browsers while not slowing down the user experience, making that accessible via JavaScript, and adding it to preferred RUM solutions and dashboards.
- smarter font loading
The number of Top 1000 websites that use custom fonts has increased from 13% to 35% in the last year (according to the HTTP Archive). The use of custom fonts is increasing rapidly. Unfortunately, custom fonts can make websites render more slowly and have Flash of Unstyled Content (FOUC) issues. These issues would be mitigated if browsers loaded fonts with some special handling:
- Browser preloaders (AKA speculative parsers and lookahead parsers) should start downloading fonts sooner. The Font Priority test page shows this does not happen today. The test page has a @font-face rule that is defined in a STYLE block in the HEAD. That font is used by the H3 element at the top of the page, which is followed by 18 images. The font and images are all on the same domain. It’s more important to download the font than the images, but all the major browsers download 6-8 images before downloading the font. That’s because the preloader sees the IMG tags and starts downloading those images first. Eventually it parses the H3 element and determines the font is needed and queues it up for the second round of downloads. It would be better if the preloader was extended to scan ahead for the definition of as well as the use of @font-face styles.
- Browsers should avoid Flash of Unstyled Text and blank elements by waiting a very short amount of time (300-500 ms) for the custom font to download. If the custom font hasn’t arrived by that time then the element should be rendered in a default font and should not be repainted if/when the custom font finally downloads. The selection of a time value is a hard decision; I lean toward a short timeout. Current behavior varies widely across major browsers. The @font-face FOUT test page shows that Chrome, Opera, and Safari leave the element blank until the font is fully downloaded. Firefox leaves it blank for ~3 seconds (too late) at which point it draws the element in a default font, and then redraws it when the custom font arrives (FOUT). IE10 draws the text immediately using a default font (too early) and then redraws it later (FOUT). Checkout Typekit’s asynchronous embed code and WebFont Loader to see how to achieve your desired behavior today. (Hint: inline your font as a data: URI inside a stylesheet.)
- Developers should be able to specify how font loading and rendering behaves. It’s going to be hard to pick a default behavior and timeout value that pleases everyone. The question are:
- Should the element be blank until the font file arrives, or should it be rendered with a default font?
- If it’s rendered with a default font, when should that happen (immediately or after a delay)?
- If it’s rendered with a default font after a delay, should it be repainted when the custom font arrives?
The Resource Priorities spec helps by defining the “resource-priorities” CSS property which can take values of “lazyload” and “postpone”, but the rendering behavior in the presence of this property isn’t specified. I propose that if “lazyload” or “postpone” is used with @font-face, then the browser should immediately render the element with a default font and it should be repainted when the font file arrives. If neither “lazyload” nor “postpone” is specified, then the element should be blank until the font file arrives or the request times out. (Note that CSS Font Load Events provides a way to do much of this programmatically.)
- Font files should be given a high priority in the browser cache. I.e., images and video should be purged from the cache before custom font files. It’s possible this is already the case – I don’t have an easy way to test this.
- Browsers should re-use expired fonts with a stale-while-revalidate policy by default. If a font file is in the cache but is expired, browsers should reuse it immediately while doing the conditional GET request in the background. This is similar to the behavior proposed for the stale-while-revalidate Cache-Control extension.
- anchor PING support
The HTML5 PING attribute for anchors is great for performance. Google Search on mobile got users to their favorite search result website 200-400 ms faster by switching from redirects to A PING. Right now A PING is only supported in Chrome and Safari. We need broader browser support.
- DEFER for inline scripts
Downloading external scripts so they don’t block the HTML parser is good. The main ways to do that today are the ASYNC and DEFER attributes. Many sites have multiple scripts with a dependency order. These sites can’t use ASYNC since that executes scripts in a non-deterministic order. Therefore, DEFER is the method of choice for interdependent external scripts. But these sites also typically have inline scripts that rely on the symbols from those external scripts. Currently, there’s no way in markup to declare that dependency.
Adding support for DEFER for inline scripts would solve this problem, but it’s currently only supported for external scripts. If it was supported for inline scripts, developers could ensure proper execution order by adding DEFER to all the relevant inline and external SCRIPT tags.
Personally, I’d prefer to see support for John Resig’s Degrading Script Tags pattern – it puts the dependent inline code within the external script’s SCRIPT block, like so:
<script src="main.js">
functionDefinedInMainJs();
</script>
The beauty of this technique is
functionDefinedInMainJsisn’t called ifmain.jsfails to load. This avoids undefined symbol errors in these failure scenarios. - lookahead for @import
Browsers use a preloader (AKA lookahead parser or speculative parser) to accelerate resource downloads while the main parser is blocked downloading scripts. The preloader does pretty well with typical resource downloads: SCRIPT, LINK, IMG, and IFRAME. But the preloader logic should be improved to accelerate the downloading of stylesheets specified with @import.
The @import Priority test page shows that the preloader in Firefox and IE 9, 10 & 11 doesn’t recognize “@import” and instead loads a bunch of images ahead of the stylesheet (even though the stylesheet is in the HEAD and the images are later in the BODY).
Another optimization for @import would be if browsers speculatively parsed the first few lines of a “main” stylesheet to see if it references any “sub” stylesheets using “@import”. If so, the browser should start downloading these “sub” stylesheets immediately without waiting for the entire “main” stylesheet to finish downloading. Fortunately, browsers only have to look at the first few lines because the CSS spec dictates that all @imports “must precede all other at-rules and style rules in a style sheet”. Unfortunately, the link with BIG @import test page shows that all major browsers wait until the entire stylesheet is downloaded before downloading an @import’ed stylesheet. Improving the browser preloader to scan stylesheets for “@import” would speedup page rendering, especially on mobile.
- UX for perception of speed
I wish browsers would invest more time in promoting a perception of speed into the browser UI. I’ve spoken about the perception of speed (video, slides). Some of the techniques are more relevant for web developers, but many ideas are targeted at browsers and thus would benefit every website. Examples include improving the browser busy indicators, clearing the page, and “natural” progress indicators.
- improved web components
I’m optimistic about the future of Web Components, but I made some suggestions in a recent series of blog posts: Async Ads with HTML Imports, Performance of Custom Elements, and HTML Imports: scope, security, and suggestions. As we specify and implement new web features it’d be good if we focused on performance to ensure a faster future on the Web.