HTML Imports: scope, security, and suggestions
This is the third of three blog posts on Web Components, primarily focusing on the performance impact of HTML imports.
Scope
The first post, Async Ads with HTML Imports, proposes using this new technology as a way to avoid the blocking behavior of synchronous ads. It’s better than using iframes because the HTML import’s LINK tag can be placed in HEAD so that the ads show up more quickly resulting in higher ad revenue.
One downside is that many ads use document.write and this erases the entire page when wrapped inside an HTML import. This is surprising for folks who know that document.write works fine within an iframe. Why shouldn’t it work just as well within an HTML import? After all, HTML imports are separate documents just like iframes. The first line of the spec confirms this:
HTML Imports, or just imports from here on, are HTML documents…
And the interface clearly shows that a document is created to contain the content:
interface Import {
    readonly attribute DOMString? href;
    readonly attribute Node ownerNode;
    readonly attribute Document content;
};
It turns out the issue is because when JavaScript in the HTML import references the “document” variable, it does NOT refer to the HTML import’s document. Instead, it refers to the main page’s document. In other words, the HTML import’s JavaScript is executed in the scope of the main page’s document, not in the scope of its own document.
Jonas Sicking (Mozilla) started a thread with the topic what scope to run in that discusses this issue. The suggested solution is to recommend that HTML imports use the MODULE tag rather than SCRIPT tags. There’s more discussion of module loaders and module namespace collision. To me the bigger issue is that, despite this recommendation, HTML imports will still have SCRIPT tags, and that JavaScript will execute in a context that is likely to be counterintuitive to developers.
It would be better if JavaScript within an HTML import was executed in the context of the HTML import’s document. The HTML import’s JavaScript could still reach the parent window’s namespace, for example, window.parent.document. Although, it would be nice if the website owner could control this access, which leads us to security.
Security
I believe Web Components will become popular as a way to reuse 3rd party widgets, but this introduces a security risk where 3rd parties might peruse information that’s confidential to the website and its users, such as cookies.
I noticed that the spec said HTML imports must be CORS-enabled. At first I thought this was to address the issue of 3rd party HTML imports accessing privileged information in the main page. But on further reading I realized it’s the other way around: the purpose is to provide a way for the HTML Import to allow the main page to access the content inside the imported document.
I created some test pages to confirm this behavior. The HTML import in the Custom Element example is CORS-enabled by adding this response header to the HTML import:
Access-Control-Allow-Origin: *
The Custom Element no CORS test page has that header removed and thus the HTML import fails. While this correctly protects the 3rd party content from being exposed to the main website, it’s important for the adoption of HTML imports to provide a means of security in the other direction. Iframes address this issue with the HTML5 sandbox attribute. I’d like to see something similar added for HTML imports.
Suggestions
These last three blog posts have talked about the performance, rendering, and JavaScript issues I found with regard to Web Components. I’d like to wrap it up by providing a list of my suggestions for Web Components:
- Add a “lazyload” attribute to
<link rel="import" ...>. This allows for faster page rendering. This might be addressed by the Resource Priorities spec, but the desired behavior needs to be implemented where HTML imports do not block rendering when a SCRIPT tag is encountered. - Add an “elements” attribute toÂ
<link rel="import" ...>. This provides a way to avoid FOUC for custom elements while allowing prior DOM elements to render. Daniel Buchner and I proposed this on the W3C public-webapps mailing list. - Make
<link rel="import" ...>valid inside BODY. Right now they’re only valid inside HEAD. It’s better if the HTML import’s LINK tag is placed in the BODY where the content is to be imported because:- It eliminates the possibility of the SCRIPT tag blocking rendering of the entire page while ALSO providing a way to make certain types of HTML imports synchronous (block rendering until the import is ready) thus avoiding FOUC.
- It makes it easier for new developers to understand the semantics of the page’s construction by having all the parts of the Web Component located next to each other.
- Make JavaScript inside an HTML import execute in the import’s document context. This is likely more intuitive for developers and provides more portability for existing JavaScript migrated to be an HTML import.
- Add a “sandbox” attribute toÂ
<link rel="import" ...>. This allows website owners to include 3rd party content while preventing those unknown sources from accessing confidential information on the page (such as cookies).
3rd party content is a performance issue that gets worse every year. I’m excited about the potential of Web Components as the specification and implementations grow to address the needs of web developers and website owners.
Performance and Custom Elements
This past week I dug into the performance of custom elements and found some surprises.
In my previous blog post, Async Ads with HTML Imports, I complained that HTML imports block the page from rendering when a SCRIPT tag is found and lamented the fact that the spec doesn’t provide a mechanism to make this coupling asynchronous. Custom elements are just the opposite: they’re asynchronous by default and the spec doesn’t provide a way to make them synchronous.
Cake and eat it too
It’s important to understand why we need both synchronous AND asynchronous mechanisms for loading content.
- Sometimes content is so critical to the page it should be rendered before anything else. In these situations it’s necessary to load the content synchronously in order to achieve the user experience desired by the website owner and designers. Synchronous loading is also necessary in other situations such as when there are dependencies between resources (e.g., interdependent scripts) and to avoid jarring changes in page layout (also known as Flash of Unstyled Content or FOUC).
- Other times, the content coming from sub-resources in the page is secondary to the main page’s content and developers & designers prefer to load it asynchronously. This is a newer pattern in web development. (I like to think I had something to do with it becoming popular.) Loading these less critical resources asynchronously produces a better user experience in terms of faster loading and rendering.
The bottomline is there are situations that call for both behaviors and developers need a way to achieve the user experience they deem appropriate. The main role for specs and browsers is to provide both mechanisms and choose a good default. We didn’t do that in the previous versions of HTML and are trying to fill that gap now with the Resource Priorities spec which adds the lazyload attribute to various tags including IMG, SCRIPT, and LINK. We don’t want to repeat this gap-filling-after-the-fact process in the future, so we need to provide sync and async capabilities to the HTML5 features being spec’ed now – and that includes Web Components.
Custom Elements howto
Note that right now the only browser I found that supports Web Components is Chrome Canary – so you’ll need to install that to play with the examples. I turned on the following flags in chrome://flags/: Experimental Web Platform features, Experimental JavaScript, and HTML Imports.
The way to define a custom element is in JavaScript. Here’s the custom element used in my examples. It creates a new custom element called x-foo:
var XFooProto = Object.create(HTMLElement.prototype);

XFooProto.createdCallback = function() {
    this.innerHTML = '<div id="imported-content" style="background: #E99; border: 2px; font-size: 2em; text-align: center; padding: 8px; height: 100px;">CUSTOM ELEMENT</div>';
};

var XFoo = document.register('x-foo', {prototype: XFooProto});
To make custom elements more reusable they’re wrapped inside an HTML import:
<link rel="import" href="import-custom-element.php">
In the HTML document we can use the custom element just like any other HTML tag:
<x-foo></x-foo>
Experienced developers recognize that this creates a race condition: what happens if the x-foo tag gets parsed before import-custom-element.php is done downloading?
(async) Custom Elements = FOUC
The first example, custom-element.php, demonstrates the typical custom element implementation described above. If you load it (in Chrome Canary) you’ll see that there’s a Flash of Unstyled Content (FOUC). This reveals that browsers handle custom elements asynchronously: the HTML import starts downloading but the browser continues to parse the page. When it reaches the x-foo tag it skips over it as an unrecognized element and renders the rest of the page. When the HTML import finishes loading the browser backfills x-foo which causes the page’s content to jump down ~100 pixels – a jarring FOUC experience.
This is great for faster rendering! I love that the default is async. And there are certainly scenarios when this wouldn’t created FOUC (custom elements that aren’t visible or will be used later) or the FOUC isn’t so jarring (below-the-fold, changes style but not layout). But in cases like this one where the FOUC is undesirable, there needs to be a way to avoid this disruptive change in layout. Sadly, the spec doesn’t provide a way of doing this. Let’s look at two possible workarounds.
Sized Custom Elements
The jarring change in layout can be avoided if the main page reserves space for the custom element. This is done in the custom-element-sized.php example like this:
<div style="height: 120px;">
<x-foo></x-foo>
</div>
The custom element is inside a fixed size container. As shown by this example, the existing page content is rendered immediately and when the HTML import finally finishes downloading the custom element is backfilled without a change in layout. We’ve achieved the best of both worlds!
The drawback to this approach is it only works for custom elements that have a fixed, predefined size. That condition might hold for some custom elements, but certainly not for all of them.
Sync Custom Elements
The custom-element-sync.php example shows a workaround to avoid FOUC for custom elements that have an unknown size. Unfortunately, this technique blocks rendering for everything in the page that occurs below the custom element. The workaround is to add a SCRIPT tag right above the custom element, for example:
<script>
var foo=128;
</script>
<x-foo></x-foo>
As shown in my previous post, HTML imports cause the parser to stop at the first SCRIPT tag that is encountered. There is a slight benefit here of making sure the only SCRIPT tag after the <link rel="import"...> is right before the custom element – this allows the content above the custom element to render without being blocked. You can see this in action in the example – only the content below the custom element is blocked from rendering until the HTML import finishes loading.
By blocking everything below the custom element we’ve avoided the FOUC issue, but the cost is high. Blocking this much content can be a bad user experience depending on the main page’s content. Certainly if the custom element occupied the entire above-the-fold area (e.g., on a mobile device) then this would be a viable alternative.
It would be better if the spec for custom elements included a way to make them synchronous. One solution proposed by Daniel Buchner and me to W3 Public Webapps is to add an attribute called “elements” to HTML imports:
<link rel="import" href="elements.html" elements="x-carousel, x-button">
The “elements” attribute is a list of the custom elements that should be loaded synchronously. (In other words, it’s NOT the list of all custom elements in the HTML import – only the ones that should cause rendering to be blocked.) As the browser parses the page it would skip over all custom elements just as it does now, unless it encounters a custom element that is listed in the “elements” attribute value (e.g., “x-carousel” and “x-button”). If one of the listed custom elements is reached, the parser would block until either the custom element becomes defined or all outstanding HTML import requests are done loading.
Tired of hacks
I love finding ways to make things work the way I want them to, but it’s wrong to resort to hacks for these new HTML5 features to achieve basic behavior like avoiding FOUC and asynchronously loading. Luckily, the specs and implementations are in early stages. Perhaps there’s still time to get them changed. An important part of that is hearing from the web development community. If you have preferences and use cases for HTML imports and custom elements, please weigh in. A little effort today will result in a better Web tomorrow.
Many thanks to the authors for these fantastic articles on Web Components:
Async Ads with HTML Imports
Scripts loaded in the typical way (<script src="a.js"></script>) block rendering which is bad for performance. The solution to this problem is to load scripts asynchronously. This is the technique used by the best 3rd party snippets, for example, Google Analytics, Tweet button, Facebook SDK, and Google+ Follow button.
Ads are probably the most prevalent 3rd party content on the Web. Unfortunately, most ads can’t be loaded asynchronously because they use document.write. (Doing document.write in an async script causes the entire page to be erased. We’ll see this in the examples below.) Some teams (GhostWriter, PageSpeed) have tried to solve the async document.write problem but it requires a lot of code and edge cases exist.
In my recent investigations into the performance of HTML Imports I discovered a way to make ads load asynchronously – even ads that use document.write. Let’s take a look at how HTML imports block, how to make HTML imports asynchronous, the dangers of doing this with document.write, and the workaround to make this all work.
HTML imports block rendering
HTML imports block rendering if used in the default way. This is unfortunate, especially given that this is a recent addition to HTML when the importance of not blocking rendering is well known. The HTML Imports spec is still a working draft, so it’s possible this could be switched so that they load asynchronously by default.
Nevertheless, HTML imports are typically created like this:
<link rel="import" href="import.php">
Content from the imported HTML document is inserted like this:
<div id=import-container></div>
<script>
var link = document.querySelector('link[rel=import]');
var content = link.import.querySelector('#imported-content');
document.getElementById('import-container').appendChild(content.cloneNode(true));
</script>
The LINK tag itself doesn’t block rendering – the browser knows the import can be downloaded asynchronously. But rendering is blocked when the browser encounters the first SCRIPT tag following the LINK. This behavior is demonstrated in the sync.php test page. To make the blocking observable, the import takes five seconds to download and then the pink “IMPORTED CONTENT” is displayed. The SCRIPT block is in the middle of the page so the first paragraph IS rendered, but the last paragraph IS NOT rendered until after five seconds. This demonstrates that HTML imports block rendering.
Running the examples: Currently HTML imports only work in Chrome Canary and you have to turn on the following flags in chrome://flags/: Experimental Web Platform features, Experimental JavaScript, and HTML Imports.
Making HTML imports async
It’s not too hard to make HTML imports asynchronous thus avoiding the default blocking behavior. Instead of using the LINK tag in markup, we create it using JavaScript:
var link = document.createElement('link');
link.rel = 'import';
link.onload = function() {
    var link = document.querySelector('link[rel=import]');
    var content = link.import.querySelector('#imported-content');
    document.getElementById('import-container').appendChild(content.cloneNode(true));
};
link.href = url;
document.getElementsByTagName('head')[0].appendChild(link);
The async.php test page shows how using this asynchronous pattern doesn’t block rendering – the last paragraph is rendered immediately, then after five seconds we see the pink “IMPORTED CONTENT” from the HTML import. This shows that HTML imports can be used without blocking the page from rendering.
HTML imports with document.write – watch out!
This is kind of weird and might be hard to grok: HTML imports have their own HTML document. BUT (here’s the complex part) any JavaScript within the HTML import is executed in the context of the main page. At least that’s the way it works now in Chrome. The spec doesn’t address this issue.
This is important because some 3rd party content (especially ads) use document.write. Some people might think that a document.write inside an HTML import would write to the HTML import’s document. But that’s not the case. Instead, document refers to the main page’s document. This can produce surprising (as in “bad”) results.
As shown in the sync docwrite.php and async docwrite.php test pages, when the HTML import contains a script that uses document.write it erases the content of the main page. If you’re uncertain whether the imported content uses document.write then it’s risky to use HTML imports. Or is it?
Safely using HTML imports with document.write
Since much 3rd party content (especially ads) use document.write, there’s a motivation to make them work with HTML imports. However, as shown by the previous examples, this can have disastrous results because when the HTML import does document.write it’s actually referencing the main page’s document and erases the main page.
There’s a simple “hack” to get around this. We can’t redefine document, but we CAN redefine document.write within the HTML import:
// inside the HTML import
document.write = function(msg) {
    document.currentScript.ownerDocument.write(msg);
};
With this change, all document.write output from scripts inside the HTML import goes to the HTML import’s document. This eliminates the problem of the HTML import clearing the main page. This fix is shown by the sync docwrite-override.php and async docwrite-override.php test pages.
Async (document.write) ads with HTML imports
Let’s see this technique in action. The async-ads.php test page includes Google’s show_ads.js to load real ads. The overridden version of document.write also echoes the output to the page so you can verify what’s happening. The document.write works and the ad is shown even though it’s loaded asynchronously.
This is a major accomplishment but there are some big caveats:
- Although we’ve overriddenÂ
document.write, there might be other JavaScript in the HTML import that assumes it’s running in the main page’s context (e.g.,location.href,document.title). - Some people believe it would be good to disable
document.write inside HTML imports, in which case ads wouldn’t work. - We need a fallback as support for HTML imports grows. This is possible by detecting support for HTML imports and reverting to the current (blocking) technique for ads.
Perhaps the biggest caveat is whether it’s realistic to expect website owners to do this. I don’t think a majority of websites would adopt this technique, but I like having an option to make ads async for websites that are willing to do the work. Right now, motivated website owners don’t have good alternatives for loading ads without blocking their own content on their page. I know some sites that have loaded ads at the bottom of the page in a hidden div and then clone them to the top when done, but this usually results in a drop in ad revenue because the ads load later. Using HTML imports allows the ad to be loaded at the top so we can have asynchronous behavior without a loss in ad revenue.
The goal of this post is to suggest that we find a way to solve one of today’s biggest obstacles to fast web pages: ads. The spec for HTML imports is a working draft and there’s only one implementation, so both are likely to change. My hope is we can make HTML imports asynchronous by default so they don’t block rendering, and use them as technique for achieving asynchronous ads.
HTTP Archive 3 Year Anniversary (Thank You Pat Meenan)
The earliest results available in the HTTP Archive are from Nov 15 2010, so in a sense this week is our three year anniversary. Three years! This was on my mind during breakfast as I thought back on how the HTTP Archive came about.
The idea came to me in 2007. I spent years evangelizing the idea which I called “the Internet Performance Archive”. The amount of work seemed large so instead of building it myself I met with various companies and encouraged them to build it, but to no avail. I knew it was worthwhile to record performance metrics aggregated across top websites. Each year that passed without this archive meant data that we’d never be able to reclaim. I felt a sense of urgency around getting the archive going.
Then, in September 2010 a confluence of events made me realize I could build it myself. The HTTP Archive file format, an effort I coordinated with Jan Odvarko (Firebug) and Simon Perkins (HttpWatch), had been announced the year before and was gaining wider support. There were more tools available that supported the HAR file format.
But the key factor was the work Pat Meenan was doing on WebPagetest. At this time Pat was working still at AOL. He was expanding the features of WebPagetest significantly and it was becoming one of the most important performance tools in the industry. On September 29 2010 I sent him this email:
Hi, Pat.
Do you have time to talk today about an idea? I’m open 10:30am-12:30pm and after 3:30pm PT.
The project is the Internet Performance Archive (I mention it here) – a data warehouse of web performance stats. I’ve been talking about this for years, and I’d like to put up a first version now that would have stats for Fortune 500, Global 500, Alexa 1000 and perhaps other major lists. I’d like to get your thoughts and figure out a way to generate the HAR files as easily as possible (ie, it doesn’t take any of your time ;-).
-Steve
In the ensuing discussion I suggested that Pat create an API for WebPagetest, so that I could build the HTTP Archive as a layer on top of it. In usual fashion, Pat informed me that the feature I wanted was already implemented. We proceeded to iterate on the initial LAMP prototype and started recording data less than two months later. After gathering six months of data the HTTP Archive was announced in March 2011.
There was one part of that initial concept that I was UNable to achieve – doing it without taking any of Pat’s time. Just the opposite, Pat has put in a ton of time to make the HTTP Archive possible. All of the tests are done on a private instance of WebPagetest (which Pat setup). When our load became too costly to run on AWS, Pat helped buy our own hardware and get it setup in our data center, Internet Systems Consortium. When we merged with the Internet Archive, Pat integrated our systems to use their S3-like storage system. He has built special widgets, added stats, and customized the data in the HAR file to make the HTTP Archive work better.
At  this three year mark I’m thankful that the HTTP Archive has grown to be a popular source for performance and other stats about how the Web works. It’s a successful project. There’s a lot more to do (most importantly moving to Github to promote more contributions so I’m less of a bottleneck) but we’ve accomplished a lot and the future is bright.
I’m thankful for our sponsors: Google, Mozilla, New Relic, O’Reilly Media, Etsy, Radware, dynaTrace Software, and Torbit (now Walmart). Their support allowed us to move to our own hardware and purchase mobile devices for the HTTP Archive Mobile.
And I’m especially thankful for Pat’s help in creating the HTTP Archive from day one. WebPagetest is awesome, as is its creator.
Prebrowsing
 A favorite character from the MASH TV series is Corporal Walter Eugene O’Reilly, fondly referred to as “Radar” for his knack of anticipating events before they happen. Radar was a rare example of efficiency because he was able to carry out Lt. Col. Blake’s wishes before Blake had even issued the orders.
What if the browser could do the same thing? What if it anticipated the requests the user was going to need, and could complete those requests ahead of time? If this was possible, the performance impact would be significant. Even if just the few critical resources needed were already downloaded, pages would render much faster.
Browser cache isn’t enough
You might ask, “isn’t this what the cache is for?” Yes! In many cases when you visit a website the browser avoids making costly HTTP requests and just reads the necessary resources from disk cache. But there are many situations when the cache offers no help:
- first visit – The cache only comes into play on subsequent visits to a site. The first time you visit a site it hasn’t had time to cache any resources.
- cleared – The cache gets cleared more than you think. In addition to occasional clearing by the user, the cache can also be cleared by anti-virus software and browser bugs. (19% of Chrome users have their cache cleared at least once a week due to a bug.)
- purged – Since the cache is shared by every website the user visits, it’s possible for one website’s resources to get purged from the cache to make room for another’s.
- expired – 69% of resources don’t have any caching headers or are cacheable for less than one day. If the user revisits these pages and the browser determines the resource is expired, an HTTP request is needed to check for updates. Even if the response indicates the cached resource is still valid, these network delays still make pages load more slowly, especially on mobile.
- revved – Even if the website’s resources are in the cache from a previous visit, the website might have changed and uses different resources.
Something more is needed.
Prebrowsing techniques
In their quest to make websites faster, today’s browsers offer a number of features for doing work ahead of time. These “prebrowsing” (short for “predictive browsing” – a word I made up and a domain I own) techniques include:
<link rel="dns-prefetch" ...><link rel="prefetch" ...><link rel="prerender" ...>- DNS pre-resolution
- TCP pre-connect
- prefreshing
- the preloader
These features come into play at different times while navigating web pages. I break them into these three phases:
- previous page – If a web developer has high confidence about which page you’ll go to next, they can use LINK REL dns-prefetch, prefetch or prerender on the previous page to finish some work needed for the next page.
- transition – Once you navigate away from the previous page there’s a transition period after the previous page is unloaded but before the first byte of the next page arrives. During this time the web developer doesn’t have any control, but the browser can work in anticipation of the next page by doing DNS pre-resolution and TCP pre-connects, and perhaps even prefreshing resources.
- current page – As the current page is loading, browsers have a preloader that scans the HTML for downloads that can be started before they’re needed.
Let’s look at each of the prebrowsing techniques in the context of each phase.
Phase 1 – Previous page
As with any of this anticipatory work, there’s a risk that the prediction is wrong. If the anticipatory work is expensive (e.g., steals CPU from other processes, consumes battery, or wastes bandwidth) then caution is warranted. It would seem difficult to anticipate which page users will go to next, but high confidence scenarios do exist:
- If the user has done a search with an obvious result, that result page is likely to be loaded next.
- If the user navigated to a login page, the logged-in page is probably coming next.
- If the user is reading a multi-page article or paginated set of results, the page after the current page is likely to be next.
Let’s take the example of searching for Adventure Time to illustrate how different prebrowsing techniques can be used.
DNS-PREFETCH
If the user searched for Adventure Time then it’s likely the user will click on the result for Cartoon Network, in which case we can prefetch the DNS like this:
<link rel="dns-prefetch" href="//cartoonnetwork.com">
DNS lookups are very low cost – they only send a few hundred bytes over the network – so there’s not a lot of risk. But the upside can be significant. This study from 2008 showed a median DNS lookup time of ~87 ms and a 90th percentile of ~539 ms. DNS resolutions might be faster now. You can see your own DNS lookup times by going to chrome://histograms/DNS (in Chrome) and searching for the DNS.PrefetchResolution histogram. Across 1325 samples my median is 50 ms with an average of 236 ms – ouch!
In addition to resolving the DNS lookup, some browsers may go one step further and establish a TCP connection. In summary, using dns-prefetch can save a lot of time, especially for redirects and on mobile.
PREFETCH
If we’re more confident that the user will navigate to the Adventure Time page and we know some of its critical resources, we can download those resources early using prefetch:
<link rel="prefetch" href="http://cartoonnetwork.com/utils.js">
This is great, but the spec is vague, so it’s not surprising that browser implementations behave differently. For example,
- Firefox downloads just one prefetch item at a time, while Chrome prefetches up to ten resources in parallel.
- Android browser, Firefox, and Firefox mobile start prefetch requests after window.onload, but Chrome and Opera start them immediately possibly stealing TCP connections from more important resources needed for the current page.
- An unexpected behavior is that all the browsers that support prefetch cancel the request when the user transitions to the next page. This is strange because the purpose of prefetch is to get resources for the next page, but there might often not be enough time to download the entire response. Canceling the request means the browser has to start over when the user navigates to the expected page. A possible workaround is to add the “Accept-Ranges: bytes” header so that browsers can resume the request from where it left off.
It’s best to prefetch the most important resources in the page: scripts, stylesheets, and fonts. Only prefetch resources that are cacheable – which means that you probably should avoid prefetching HTML responses.
PRERENDER
If we’re really confident the user is going to the Adventure Time page next, we can prerender the page like this:
<link rel="prerender" href="http://cartoonnetwork.com/">
This is like opening the URL in a hidden tab – all the resources are downloaded, the DOM is created, the page is laid out, the CSS is applied, the JavaScript is executed, etc. If the user navigates to the specified href, then the hidden page is swapped into view making it appear to load instantly. Google Search has had this feature for years under the name Instant Pages. Microsoft recently announced they’re going to similarly use prerender in Bing on IE11.
Many pages use JavaScript for ads, analytics, and DHTML behavior (start a slideshow, play a video) that don’t make sense when the page is hidden. Website owners can workaround this issue by using the page visibility API to only execute that JavaScript once the page is visible.
Support for dns-prefetch, prefetch, and prerender is currently pretty spotty. The following table shows the results crowdsourced from my prebrowsing tests. You can see the full results here. Just as the IE team announced upcoming support for prerender, I hope other browsers will see the value of these features and add support as well.
| dns-prefetch | prefetch | prerender | |
|---|---|---|---|
| Android 4 | 4 | ||
| Chrome | 22+ | 31+1 | 22+ |
| Chrome Mobile | 29+ | ||
| Firefox | 22+2 | 23+2 | |
| Firefox Mobile | 24+ | 24+ | |
| IE | 113 | 113 | 113 |
| Opera | 15+ |
- 1 Need to use the
--prerender=enabledcommandline option. - 2 My friend at Mozilla said these features have been present since version 12.
- 3 This is based on a Bing blog post. It has not been tested.
Ilya Grigorik‘s High Performance Networking in Google Chrome is a fantastic source of information on these techniques, including many examples of how to see them in action in Chrome.
Phase 2 – Transition
When the user clicks a link the browser requests the next page’s HTML document. At this point the browser has to wait for the first byte to arrive before it can start processing the next page. The time-to-first-byte (TTFB) is fairly long – data from the HTTP Archive in BigQuery indicate a median TTFB of 561 ms and a 90th percentile of 1615 ms.
During this “transition” phase the browser is presumably idle – twiddling its thumbs waiting for the first byte of the next page. But that’s not so! Browser developers realized that this transition time is a HUGE window of opportunity for performance prebrowsing optimizations. Once the browser starts requesting a page, it doesn’t have to wait for that page to arrive to start working. Just like Radar, the browser can anticipate what will need to be done next and can start that work ahead of time.
DNS pre-resolution & TCP pre-connect
The browser doesn’t have a lot of context to go on – all it knows is the URL being requested, but that’s enough to do DNS pre-resolution and TCP pre-connect. Browsers can reference prior browsing history to find clues about the DNS and TCP work that’ll likely be needed. For example, suppose the user is navigating to http://cartoonnetwork.com/. From previous history the browser can remember what other domains were used by resources in that page. You can see this information in Chrome at chrome://dns. My history shows the following domains were seen previously:
- ads.cartoonnetwork.com
- gdyn.cartoonnetwork.com
- i.cdn.turner.com
During this transition (while it’s waiting for the first byte of Cartoon Network’s HTML document to arrive) the browser can resolve these DNS lookups. This is a low cost exercise that has significant payoffs as we saw in the earlier dns-prefetch discussion.
If the confidence is high enough, the browser can go a step further and establish a TCP connection (or two) for each domain. This will save time when the HTML document finally arrives and requires page resources. The Subresource PreConnects column in chrome://dns indicates when this occurs. For more information about dns-presolution and tcp-preconnect see DNS Prefetching.
Prefresh
Similar to the progression from LINK REL dns-prefetch to prefetch, the browser can progress from DNS lookups to actual fetching of resources that are likely to be needed by the page. The determination of which resources to fetch is based on prior browsing history, similar to what is done in DNS pre-resolution. This is implemented as an experimental feature in Chrome called “prefresh” that can be turned on using the --speculative-resource-prefetching="enabled" flag. You can see the resources that are predicted to be needed for a given URL by going to chrome://predictors and clicking on the Resource Prefetch Predictor tab.
The resource history records which resources were downloaded in previous visits to the same URL, how often the resource was hit as well as missed, and a score for the likelihood that the resource will be needed again. Based on these scores the browser can start downloading critical resources while it’s waiting for the first byte of the HTML document to arrive. Prefreshed resources are thus immediately available when the HTML needs them without the delays to fetch, read, and preprocess them. The implementation of prefresh is still evolving and being tested, but it holds potential to be another prebrowsing timesaver that can be utilized during the transition phase.
Phase 3 – Current Page
Once the current page starts loading there’s not much opportunity to do prebrowsing – the user has already arrived at their destination. However, given that the average page takes 6+ seconds to load, there is a benefit in finding all the necessary resources as early as possible and downloading them in a prioritized order. This is the role of the preloader.
Most of today’s browsers utilize a preloader – also called a lookahead parser or speculative parser. The preloader is, in my opinion, the most important browser performance optimization ever made. One study found that the preloader alone improved page load times by ~20%. The invention of preloaders was in response to the old browser behavior where scripts were downloaded one-at-a-time in daisy chain fashion.
Starting with IE 8, parsing the HTML document was modified such that it forked when an external SCRIPT SRC tag was hit: the main parser is blocked waiting for the script to download and execute, but the lookahead parser continues parsing the HTML only looking for tags that might generate HTTP requests (IMG, SCRIPT, LINK, IFRAME, etc.). The lookahead parser queues these requests resulting in a high degree of parallelized downloads. Given that the average web page today has 17 external scripts, you can imagine what page load times would be like if they were downloaded sequentially. Being able to download scripts and other requests in parallel results in much faster pages.
The preloader has changed the logic of how and when resources are requested. These changes can be summarized by the goal of loading critical resources (scripts and stylesheets) early while loading less critical resources (images) later. This simple goal can produce some surprising results that web developers should keep in mind. For example:
- JS responsive images get queued last – I’ve seen pages that had critical (bigger) images that were loaded using a JavaScript responsive images technique, while less critical (smaller) images were loaded using a normal IMG tag. Most of the time I see these images being downloaded from the same domain. The preloader looks ahead for IMG tags, sees all the less critical images, and adds those to the download queue for that domain. Later (after DOMContentLoaded) the JavaScript responsive images technique kicks in and adds the more critical images to the download queue – behind the less critical images! This is often not the expected nor desired behavior.
- scripts “at the bottom” get loaded “at the top” – A rule I promoted starting in 2007 is to move scripts to the bottom of the page. In the days before preloaders this would ensure that all the requests higher in the page, including images, got downloaded first – a good thing when the scripts weren’t needed to render the page. But most preloaders give scripts a higher priority than images. This can result in a script at the bottom stealing a TCP connection from an image higher in the page causing above-the-fold rendering to take longer.
When it comes to the preloader the bottomline is that the preloader is a fantastic performance optimization for browsers, but the logic is new and still evolving so web developers should be aware of how the preloader works and watch their pages for any unexpected download behavior.
As the low hanging fruit of web performance optimization is harvested, we have to look harder to find the next big wins. Prebrowsing is an area that holds a lot of potential to deliver pages instantly. Web developers and browser developers have the tools at their disposal and some are taking advantage of them to create these instant experiences. I hope we’ll see even wider browser support for these prebrowsing features, as well as wider adoption by web developers.
[Here are the slides and video of my Prebrowsing talk from Velocity New York 2013.]
Domain Sharding revisited
With the adoption of SPDY and progress on HTTP 2.0, I hear some people referring to domain sharding as a performance anti-pattern. I disagree. Sharding resources across multiple domains is a major performance win for many websites. However, there is room for debate. Domain sharding isn’t appropriate for everyone. It may hurt performance if done incorrectly. And it’s utility might be short-lived. Is it worth sharding domains? Let’s take a look.
Compelling Data
The HTTP Archive has a field call “maxDomainReqs”. The explanation requires a few sentences: Websites request resources from various domains. The average website today accesses 16 different domains as shown in the chart below. That number has risen from 12.5 a year ago. That’s not surprising given the rise in third party content (ads, widgets, analytics).
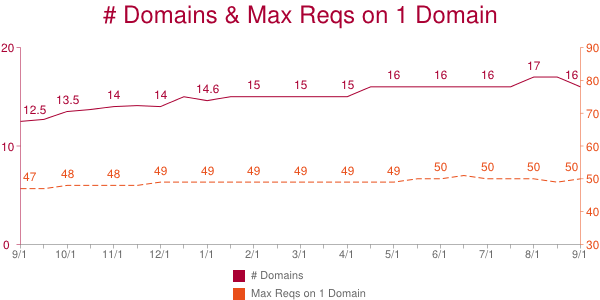
The HTTP Archive counts the number of requests made on each domain. The domain with the most requests is the “max domain” and the number of requests on that domain is the “maxDomainReqs”. The average maxDomainReqs value has risen from 47 to 50 over the past year. That’s not a huge increase, but the fact that the average number of requests on one domain is so high is startling.
50 is the average maxDomainReqs across the world’s top 300K URLs. But averages don’t tell the whole story. Using the HTTP Archive data in BigQuery and bigqueri.es, both created by Ilya Grigorik, it’s easy to find percentile values for maxDomainReqs: the 50th percentile is 39, the 90th percentile is 97, and the 95th percentile is 127 requests on a single domain.
This data shows that a majority of websites have 39 or more resources being downloaded from a single domain. Most browsers do six requests per hostname. If we evenly distribute these 39 requests across the connections, each connection must do 6+ sequential requests. Response times per request vary widely, but I use 500 ms as an optimistic estimate. If we use 500 ms as the typical responsive time, this introduces a 3000 ms long pole in the response time tent. In reality, requests are assigned to whatever connection is available, and 500 ms might not be the typical response time for your requests. But given the six-connections-per-hostname limit, 39 requests on one domain is a lot.
Wrong sharding
There are costs to domain sharding. You’ll have to modify your website to actually do the sharding. This is likely a one time cost; the infrastructure only has to be setup once. In terms of performance the biggest cost is the extra DNS lookup for each new domain. Another performance cost is the overhead of establishing each TCP connection and ramping up its congestion window size.
Despite these costs, domain sharding has great benefit for websites that need it and do it correctly. That first part is important – it doesn’t make sense to do domain sharding if your website has a low “maxDomainReqs” value. For example, if the maximum number of resources downloaded on a single domain is 6, then you shouldn’t deploy domain sharding. With only 6 requests on a single domain, most browsers are able to download all 6 in parallel. On the other hand, if you have 39 requests on a single domain, sharding is probably a good choice. So where’s the cutoff between 6 and 39? I don’t have data to answer this, but I would say 20 is a good cutoff. Other aspects of the page affect this decision. For example, if your page has a lot of other requests, then those 20 resources might not be the long pole in the tent.
The success of domain sharding can be mitigated if it’s done incorrectly. It’s important to keep these guidelines in mind.
- It’s best to shard across only two domains. You can test larger values, but previous tests show two to be the optimal choice.
- Make sure that the sharding logic is consistent for each resource. You don’t want a single resource, say main.js, to flip-flop between domain1 and domain2.
- You don’t need to setup different servers for each domain – just create CNAMEs. The browser doesn’t care about the final IP address – it only cares that the hostnames are different.
These and other issues are explained in more detail in Chapter 11 of Even Faster Web Sites.
Short term hack?
Perhaps the strongest argument against domain sharding is that it’s unnecessary in the world of SPDY (as well as HTTP 2.0). In fact, domain sharding probably hurts performance under SPDY. SPDY supports concurrent requests (send all the request headers early) as well as request prioritization. Sharding across multiple domains diminishes these benefits. SPDY is supported by Chrome, Firefox, Opera, and IE 11. If your traffic is dominated by those browsers, you might want to skip domain sharding. On the other hand, IE 6&7 are still somewhat popular and only support 2 connections per hostname, so domain sharding is an even bigger win in those browsers.
A middle ground is to alter domain sharding depending on the client: 1 domain for browsers that support SPDY, 2 domains for non-SPDY modern browsers, 3-4 domains for IE 6-7. This makes domain sharding harder to deploy. It also lowers the cache hit rate on intermediate proxies.
There’s no need for domain sharding in the world of HTTP 2.0 across all popular browsers. Until then, there’s no silver bullet answer. But if you’re one of the websites with 39+ resources on a single hostname, domain sharding is worth exploring.
Web performance for the future
I started working on web performance around 2003. My first major discovery was the Performance Golden Rule:
80-90% of the end-user response time is spent on the frontend. Start there.
Up until that point all of my web development experience had been on the backend – Apache, MySQL, Perl, Java, C & C++. When I saw how much time was being spent on the frontend, I knew my performance research had to focus there.
My first discussion about web performance was with Nate Koechley when we both worked at Yahoo!. (Now we’re both at Google!) I hadn’t met Nate before, but someone told me he was the person to talk to about clientside development. I don’t think YUI existed yet, but Nate and other future YUI team members were present, leading pockets of web development throughout the company.
God bless Nate and those other folks for helping me out. I was so ignorant. I was good at finding performance inefficiencies, but I hadn’t done much frontend development. They helped me translate those inefficiencies into best practices. The other thing was – this was still early days in terms of frontend development. In fact, when I was writing my first book I didn’t know what words to use to refer to my target reader. I asked Nate and he said “F2E – frontend engineer”.
Today it might seem funny to ask that question, but frontend engineering was a new discipline back then. This was before YUI, before Firebug, before jQuery – it was a long time ago! Back then, most companies asked their backend (Java & C) developers to take a swag at the frontend code. (Presumably you had a head start if you knew Java because JavaScript was probably pretty similar.)
Fast forward to today when most medium-to-large web companies have dedicated frontend engineers, and many have dedicated frontend engineering teams. (I just saw this at Chegg last week.) Frontend engineering has come a long way. It’s a recognized and respected discipline, acknowledged as critical by anyone with a meaningful presence on the Web.
I like to think that web performance has helped frontend engineering grow into the role that it has today. Quantifying and evangelizing how web performance is critical to creating a good user experience and improves business metrics focuses attention on the frontend. People who know the Web know that quality doesn’t stop when the bytes leave the web server. The code running in the browser has be highly optimized. To accomplish this requires skilled engineers with established best practices, and the willingness and curiosity to adapt to a constantly changing platform. Thank goodness for frontend engineers!
This reminiscing is the result of my reflecting on the state of web performance and how it needs to grow. I’ve recently written and spoken about the overall state of the Web in terms of performance. While page load times have gotten faster overall, this is primarily due to faster connection speeds and faster browsers. The performance quality of sites seems to be getting worse: pages are heavier, fewer resources are cacheable, the size of the DOM is growing, etc.
How can we improve web performance going forward?
The state of web performance today reminds me of frontend engineering back in the early days. Most companies don’t have dedicated performance engineers, let alone performance teams. Instead, the job of improving performance is tacked on to existing teams. And because web performance spans frontend, backend, ops, and QA it’s not clear which team should ride herd. I shake my head every time a new performance best practice is found. There’s so much to know already, and the body of knowledge is growing.
Asking backend developers to do frontend engineering is a mistake. Frontend engineering is an established discipline. Similarly, asking fronted|backend|ops|QA engineers to take on performance engineering is a mistake. Performance engineering is its own discipline. The problem is, not many people have realized that yet. Our performance quality degrades as we ask teams to focus on performance “just for this quarter” or for “25% of your time”. Progress is made, and then erodes when attention focuses elsewhere. Best practices are adopted, but new best practices are missed when we cycle off performance.
What’s needed are dedicated web performance engineers and dedicated performance teams. Just like frontend engineering, these teams will start small – just one person at first. But everyone will quickly see how the benefits are bigger, are reached sooner, and don’t regress. The best practices will become more widely known. And the performance quality of the Web will steadily grow.
ActiveTable bookmarklet
I write a lot of code that generates HTML tables. If the code gets a lot of use, I’ll go back later and integrate my default JavaScript library to do table sorting. (My code is based on Standardista Table Sorting by Neil Crosby.) In addition to sorting, sometimes it’s nice to be able to hide superfluous columns. For example, the HTTP Archive page for viewing a single website’s results (e.g., WholeFoods) has a table with 39 columns! I wrote some custom JavaScript to allow customizing which columns were displayed. But generally, I generate tables that aren’t sortable and have fixed columns.
It turns out, this is true for many websites. Each day I visit a few pages with a table that I wish was sortable. Sometimes there are so many columns I wish I could hide the less important ones. This is especially true if my 13″ screen is the only monitor available.
This problem finally became big enough that I wrote a bookmarklet to solve the problem: activetable.js
Here’s how to use it:
1. Add this ActiveTable bookmarklet link to your bookmarks. (Drag it to your Bookmarks toolbar, or right-click and add the link to your bookmarks.)
2. Go to a page with a big table. For example, Show Slow. Once that page is loaded, click on the ActiveTable bookmark. This loads activetable.js which makes the table sortable and customizable. The table’s header row is briefly highlighted in blue to indicate it’s active.
3. Hover over a column you want to sort or remove. The ActiveTable widget is displayed:

4. Click on the sort icon to toggle between ascending and descending. Click on the red “X” to hide the column. To UNhide all columns just alt+click on any TH element.
Another nice feature of ActiveTable is the columns you choose to hide are stored in localStorage. The next time you come to the same page and launch ActiveTable, you’re asked if you want to hide the same columns again.
CAVEATS: I’ve only tested the code on Chrome and Firefox. Tables with TD cells that span multiple rows or columns may not work as expected.
You can test it out on these real world pages:
- Voting Record For Feinstein – This table is 20 pages long and doesn’t have any way to sort.Â
- World University Rankings – This table is already sortable, but sorting the table causes the entire page to reload. ActiveTable does sorting in place, without a reload.
- Imdb All-Time USA Box office – Even though this table has 557 rows, it’s not sortable. ActiveTable allows sorting, but sorts the dollar values alphabetically.
I love having my Web my way. ActiveTable makes it more enjoyable for me to wade through the massive tables I encounter every day.
Twitter widget update
A few weeks ago I had Chrome Dev Tools open while loading my personal website and noticed the following console messages:

I have a Twitter widget in my web page. I think this notice of deprecation is interesting. I use several 3rd party widgets and have never noticed a developer-targeted warning like this. Perhaps it’s done frequently, but this was the first time I saw anything like this.
I really appreciated the heads up. The previous Twitter widget loaded a script synchronously causing bad performance. I had “asyncified” the snippet by reverse engineering the code. (See slides 11-18 from my Fluent High Performance Snippets presentation.) This was about an hour of work and resulted in ~40 lines of additional JavaScript in my page.
The new Twitter snippet is asynchronous – yay! I’m able to replace my hack with one line of markup and one line of JavaScript. All the options I want (size, color, etc.) are available. I just did the update today and am looking forward to seeing if it reduces my onload metrics.
Getting consumers to update old snippet code is a challenge for snippet owners. This is why so many sites use bootstrap scripts. The downside is bootstrap scripts typically result in two script downloads resulting in a slower snippet rendering time.
An interesting study that could be done with data from the HTTP Archive would be to analyze the adoption of new snippets. For example, tracking the migration from urchin.js to ga.js, or widgets.twimg.com/.../widget.js to platform.twitter.com/widgets.js. This would require a way to identify the before and after script. Correlating this with the techniques used to motivate website owners to change their code could help identify some best practices.
Twitter’s technique of logging warnings to console worked for me, but I don’t know how long ago they offered the async snippet version. Perhaps I’ve been lagging for months. I bet we could identify other good (and bad) techniques for evangelizing a massive code upgrade for third party widgets. That would be a good thing.
Browser Busy Indicators
I’m doing research on the perception of speed for my Ignite Velocity talk. The perception of website speed is obviously fueled by what the user sees in the browser. While the content of a website is controlled by the website owner, the browser also provides feedback to the user. This browser feedback affects user perception of website speed. Good developers need to understand how their code affects what users see, including the browser feedback that’s triggered (or not triggered).
Busy Indicators
Let’s start by enumerating the browser’s feedback mechanisms. I’ve identified six ways that browsers give feedback when they’re busy doing some action:

- tab icon – This is typically the site’s favicon. It turns to a spinner when that tab is busy.
- status bar – Some browsers display a message about outstanding requests in the status bar.
- reload icon – The reload icon (typically a circular arrow) changes to an “X” during downloads.
- progress bar – Some browsers have a progress bar. Opera shows the fraction of completed downloads:

- network busy – iOS shows a busy indicator whenever there’s network traffic. (Technically this is outside the browser but I included it since it’s a strong visual cue at the top of the screen.)
- cursor – In some situations the cursor changes to a “progress cursor”.
Test Scenarios
The browser busy indicators are triggered during normal web surfing such as clicking links. They’re also triggered by some of the dynamic behaviors popular in today’s web pages. I came up with this list of scenarios under which to measure browser busy indicators:
- click link – Click a link to another web page.
- async script – The HTML document contains
<SCRIPT ASYNC SRC="...">. - dynamic script before onload – The HTML document loads a script usingÂ
document.createElement('script') andappendChild(). - dynamic iframe – Clicking a button initiates the loading of an iframe usingÂ
document.createElement('iframe')Â andÂappendChild(). - dynamic script – Same as dynamic iframe but with a script.
- dynamic stylesheet – Same as dynamic iframe but with a stylesheet.
- dynamic image – Same as dynamic iframe but with an image.
- dynamic background image – Same as dynamic iframe but with a CSS background image.
- XHR – Clicking a button initiates an XMLHttpRequest.
- long JS loop – Clicking a button initiates some JavaScript that loops for a few seconds.
I chose these scenarios to mimic real world situations. For example, many single page web apps use XHR – do those trigger any browser busy indicators? Photo carousels often fetch images dynamically – does the user get any feedback from the browser when that happens?
You can see the specific code for each scenario on this test page. I ran each scenario across the major browsers and recorded the results in a Browserscope user test.
Results
Many of the test cases didn’t trigger any of the browser busy indicators: dynamic script, dynamic stylesheet, dynamic image, dynamic background image, XHR, and long JS loop. (Except on iOS the network spinner was triggered for every test that involved an HTTP request.) I didn’t include these tests in the results table. The results for click link, async script, dynamic script before onload, and dynamic iframe are shown in the following table.
| browser | click link | async script | dynamic script before onload |
dynamic iframe |
|---|---|---|---|---|
| Chrome 27 (Mac OS) | TSCPRN | TSCPRN | TSCPRN | TSCPRN |
| Chrome 27 (Windows) | TSCPRN | TSCPRN | TSCPRN | TSCPRN |
| Firefox 21 (Mac OS) | TSCPRN | TSCPRN | TSCPRN | TSCPRN |
| Firefox 21 (Windows) | TSCPRN | TSCPRN | TSCPRN | TSCPRN |
| IE 9 (Windows) | TSCPRN | TSCPRN | TSCPRN | TSCPRN |
| Opera 12 (Mac OS) | TSCPRN | TSCPRN | TSCPRN | TSCPRN |
| Opera 12 (Windows) | TSCPRN | TSCPRN | TSCPRN | TSCPRN |
| Safari 6 (Mac OS) | TSCPRN | TSCPRN | TSCPRN | TSCPRN |
| Safari 5 (Windows) | TSCPRN | TSCPRN | TSCPRN | TSCPRN |
| Mobile: | ||||
| Android 4 | TSCPRN | TSCPRN | TSCPRN | TSCPRN |
| Chrome Mobile 26 | TSCPRN | TSCPRN | TSCPRN | TSCPRN |
| Mobile Safari 6 | TSCPRN | TSCPRN | TSCPRN | TSCPRN |
Each result is essentially a bitmask indicating whether the busy indicator was triggered. For example, the first result for “Chrome 27 (Mac OS)” and the “click link” test is TSCPRN. This means the Tab icon, Status bar, and Reload icon indicators were triggered; but the Cursor, Progress bar, and Network indicators were not triggered. A few notes about the indicators:
- The network indicator is only applicable for Mobile Safari.
- The progress bar indicator is only applicable for Opera, Safari, Android, Chrome Mobile, and Mobile Safari.
- Mobile browsers don’t have tabs, status bars, nor cursors (currently) so those indicators aren’t applicable.
Takeaways
The purpose of these tests is to see how the browser busy indicators might affect the user’s perception of speed under different scenarios. The tests themselves are contrived, but it’s easy (and necessary) to put them in the context of a web page.
For example, if a feature involves a JSON request, which technique should be used? These browser busy indicators provide some guidance. If the JSON data is asynchronous to the user experience, such as updating stock quotes or friends’ online status, then it would be better to not trigger the browser busy indicators. Doing so would make the user pause their current actions and wonder what the web page was doing. Conversely, if the feature was synchronous to the user experience, such as opening a mail folder, then it would be better to give the user feedback that the action was being performed.
In this context we note that the dynamic iframe technique triggers busy indicators in some browsers. Therefore, this would be a bad choice for background tasks. And if it was chosen for a synchronous action it should be augmented to provide feedback across all browsers (such as a progress icon or busy spinner).
One of the biggest takeaways for me was that the progress cursor is only triggered on Windows. I find this to be a primary feedback mechanism when using the mouse – especially when clicking a link. These Mozilla bug comments seem to point to this being a Mac OS design guideline. I find it distracting on Mac OS to have to move my eye away from where I’m focusing in order to get feedback that my click was “heard”.
On the note of techniques that do not trigger busy indicators, almost all of the dynamic loading techniques fall into this category, the exception being dynamic iframe. (By “dynamic loading” I mean using JavaScript to initiate the HTTP request.)Â This is good and bad. Often dynamic images are used to beacon back metrics and logging information. It’s good to know these beacons aren’t interfering with the user experience. On the other hand, if a synchronous feature loads scripts dynamically, it might be necessary to provide other feedback to the user that the action is being carried out.
These busy indicators have an impact on the user’s perception of website speed. Triggering busy indicators for actions that are supposed to be in the background brings them to the user’s attention making the experience feel slower. If a user’s action is synchronous but there’s no feedback, that’s frustrating and makes the experience seem longer than it actually is. We can produce better user experiences by taking these tradeoffs into consideration and avoiding them or augmenting them depending on the situation.