Making the HTTP Archive faster
This week I finally got time to do some coding on the HTTP Archive. Coincidentally (ironically?) I needed to focus on performance. Hah! This turned out to be a good story with a few takeaways – info about the HTTP Archive, some MySQL optimizations, and a lesson learned about dynamic script loaders.
Setting the stage
The HTTP Archive started in November 2010 by analyzing 10K URLs and storing their information (subresource URLs, HTTP headers, sizes, etc.) in a MySQL database. We do these runs twice each month. In November 2011 we began increasing the number of URLs to 25K, 50K, 75K, and finally hit 100K this month. Our goal is to hit 1M URLs by the end of 2012.

The MySQL schema in use today is by-and-large the same one I wrote in a few hours back in November 2010. I didn’t spend much time on it – I’ve created numerous databases like this and was able to quickly get something that got the job done and was fast. I knew it wouldn’t scale as the size of the archive and number of URLs grew, but I left that for another day.
That day had arrived.
DB schema
The website was feeling slow. I figured I had reached that curve in the hockey stick where my year-old schema that worked on two orders of magnitude less data was showing its warts. I saw plenty of slow queries in the log. I occasionally did some profiling and was easily able to identify queries that took 500 ms or more; some even took 10+ seconds. I’ve built big databases before and had some tricks up my sleeve so I sat down today to pinpoint the long poles in the tent and cut them down.
The first was pretty simple. The urls table has over 1M URLs. The only index was based on the URL string – a blob. It took 500-1000 ms to do a lookup. The main place this happens is looking up the URL’s rank, for example, in the last crawl Whole Foods was ranked 5,872 (according to Alexa). This is a fairly non-critical piece of information, so slowing down the page 500-1000 ms wasn’t acceptable. Plus this seems like a simple lookup ripe for optimizing.
When I described this problem to my Velocity co-chair, John Allspaw, he suggested creating a hash for the URL that would be faster to index. I understood the concept but had never done this before. I didn’t find any obvious pointers out there on “the Web” so I rolled my own. I started with md5(), but that produced a fairly long string that was alphanumeric (hex):
select md5("http://www.wholefoodsmarket.com/");
=> 0a0936fe5c690a3b468a6895efaaff83
I didn’t think it would be that much faster to index off the md5() hex string (although I didn’t test this). Assuming that md5() strings are evenly distributed, I settled on taking a substring:
select substring(md5("http://www.wholefoodsmarket.com/"), 1, 4);
=> 0a09
This was still hex and I thought an int would be a faster index (but again, I didn’t test this). So I added a call to conv() to convert the hex to an int:
select conv(substring(md5("http://www.wholefoodsmarket.com/"), 1, 4), 16, 10);
=> 2569
I was pretty happy. This maps URLs across 64K hashes. I’m assuming they’re evenly distributed. This conversion is only done a few times per page so the overhead is low. If you have a better solution please comment below, but overall I thought this would work – and it did! Those 500+ ms queries went down to < 1 ms. Yay!
But the page was still slow. Darn!
Duh – it’s the frontend
This and a few other MySQL changes shaved a good 2-3 seconds of the page load time but the page still felt slow. The biggest problem was rendering – I could tell the page arrived quickly but something was blocking the rendering. This is more familiar performance territory for me so I gleefully rolled up my sleeves and pulled out my WPO toolbox.
The page being optimized is viewsite.php. I used WebPagetest to capture a waterfall chart and screenshots for Chrome 18, Firefox 11, IE 8, and IE 9. The blocking behavior and rendering times were not what I consider high performance. (Click on the waterfall chart to go to the detailed WebPagetest results.)
Chrome 18:

Firefox 11:

Internet Explorer 8:

Internet Explorer 9:

These waterfall charts looked really wrong to me. The start render times (green vertical line) were all too high: Chrome 1.2 seconds, Firefox 2.6 seconds, IE8 1.6 seconds, and IE9 2.4 seconds. Also, too many resources were downloading and potentially blocking start render. This page has a lot of content, but most of the scripts are loaded asynchronously and so shouldn’t block rendering. Something was defeating that optimization.
Docwrite blocks
I immediately honed in on jquery.min.js because it was often in the critical path or appeared to push out the start render time. I saw in the code that it was being loaded using Google Libraries API. Here’s the code that was being used to load jquery.min.js:
<script src="http://www.google.com/jsapi"></script>
<script>
google.load("jquery", "1.5.1");
</script>
I’ve looked at (and built) numerous async script loaders and know there are a lot of details to get right, so I dug into the jsapi script to see what was happening. I saw the typical createElement-insertBefore pattern popularized by the Google Analytics async snippet. But upon walking through the code I discovered that jquery.min.js was being loaded by this line:
m.write('<script src="'+b+'" type="text/javascript"><\/script>'):
The jsapi script was using document.write to load jquery.min.js. While it’s true that document.write has some asynchronous benefits, it’s more limited than the createElement-insertBefore pattern. Serendipitously, I was just talking with someone a few weeks ago about deprecating the jsapi script because it introduces an extra HTTP request, and instead recommend that people just load the script directly. So that’s what I did.
We don’t need no stinkin’ script loader
In my case I knew that jquery.min.js could be loaded async, so I replaced the google.load code with this:
var sNew = document.createElement("script");
sNew.async = true;
sNew.src = "http://ajax.googleapis.com/ajax/libs/jquery/1.5.1/jquery.min.js";
var s0 = document.getElementsByTagName('script')[0];
s0.parentNode.insertBefore(sNew, s0);
This made the start render times and waterfall charts look much better:
Chrome 18:

Firefox 11:

Internet Explorer 8:

Internet Explorer 9:

There was better parallelization of downloads and the start render times improved. Chrome went from 1.2 to 0.9 seconds. Firefox went from 2.6 to 1.3 seconds. IE8 went from 1.6 to 1.1 seconds. IE9 went from 2.4 to 1.0 seconds.
This was a fun day spent making the HTTP Archive faster. Even though I consider myself a seasoned veteran when it comes to web performance, I still found a handful of takeaways including some oldies that still ring true:
- Even for web pages that have significant backend delays, don’t forget to focus on the frontend. After all, that is the Performance Golden Rule.
- Be careful using script loaders. They have to handle diverse script loading scenarios across a large number of browsers. If you know what you want it might be better to just do it yourself.
- Be careful using JavaScript libraries. In this case
jquery.min.jsis only being used for the drop down About menu. That’s 84K (~30K compressed) of JavaScript for a fairly simple behavior.
If you’re curious about why document.write results in worse performance for dynamic script loading, I’ll dig into that in tomorrow’s blog post. Hasta mañana.
Cache compressed? or uncompressed?
My previous blog post, Cache them if you can, suggests that current cache sizes are too small – especially on mobile.
Given this concern about cache size a relevant question is:
If a response is compressed, does the browser save it compressed or uncompressed?
Compression typically reduces responses by 70%. This means that a browser can cache 3x as many compressed responses if they’re saved in their compressed format.
Note that not all responses are compressed. Images make up the largest number of resources but shouldn’t be compressed. On the other hand, HTML documents, scripts, and stylesheets should be compressed and account for 30% of all requests. Being able to save 3x as many of these responses to cache could have a significant impact on cache hit rates.
It’s difficult and time-consuming to determine whether compressed responses are saved in compressed format. I created this Caching Gzip Test page to help determine browser behavior. It has two 200 KB scripts – one is compressed down to ~148 KB and the other is uncompressed. (Note that this file is random strings so the compression savings is only 25% as compared to the typical 70%.) After clearing the cache and loading the test page if the total cache disk size increases ~348 KB it means the browser saves compressed responses as compressed. If the total cache disk size increases ~400 KB it means compressed responses are saved uncompressed.
The challenging part of this experiment is finding where the cache is stored and measuring the response sizes. Firefox, Chrome, and Opera save responses as files and were easy to measure. For IE on Windows I wasn’t able to access the individual cache files (admin permissions?) but was able to measure the sizes based on the properties of the Temporary Internet Files folder. Safari saves all responses in Cache.db. I was able to see the incremental increase by modifying the experiment to be two pages: the compressed response and the uncompressed response. You can see the cache file locations and full details in the Caching Gzip Test Results page.
Here are the results for top desktop browsers:
| Browser | Compressed responses cached compressed? |
max cache size |
|---|---|---|
| Chrome 17 | yes | 320 MB* |
| Firefox 11 | yes | 850 MB* |
| IE 8 | no | 50 MB |
| IE 9 | no | 250 MB |
| Safari 5.1.2 | no | unknown |
| Opera 11 | yes | 20 MB |
* Chrome and Firefox cache size is a percentage of available disk space. Chrome is capped at 320 MB. I don’t know what Firefox’s cap is; on my laptop with 50 GB free the cache size is 830 MB.
We see that Chrome 17, Firefox 11, and Opera 11 store compressed responses in compressed format, while IE 8&9 and Safari 5 save them uncompressed. IE 8&9 have smaller cache sizes, so the fact that they uncompress responses before caching further reduces the number of responses that can be cached.
What’s the best choice? It’s possible that reading cached responses is faster if they’re already uncompressed. That would be a good next step to explore. I wouldn’t prejudge IE’s choice when it comes to performance on Windows. But it’s clear that saving compressed responses in compressed format increases the number of responses that can be cached, and this increases cache hit rates. What’s even clearer is that browsers don’t agree on the best answer. Should they?
Cache them if you can
“The fastest HTTP request is the one not made.”
I always smile when I hear a web performance speaker say this. I forget who said it first, but I’ve heard it numerous times at conferences and meetups over the past few years. It’s true! Caching is critical for making web pages faster. I’ve written extensively about caching:
- Call to improve browser caching
- (lack of) Caching for iPhone Home Screen Apps
- Redirect caching deep dive
- Mobile cache file sizes
- Improving app cache
- Storager case study: Bing, Google
- App cache & localStorage survey
- HTTP Archive: max-age
Things are getting better – but not quickly enough. The chart below from the HTTP Archive shows that the percentage of resources that are cacheable has increased 10% during the past year (from 42% to 46%). Over that same time the number of requests per page has increased 12% and total transfer size has increased 24% (chart).

Perhaps it’s hard to make progress on caching because the problem doesn’t belong to a single group – responsibility spans website owners, third party content providers, and browser developers. One thing is certain – we have to do a better job when it comes to caching.Â
I’ve gathered some compelling statistics over the past few weeks that illuminate problems with caching and point to some next steps. Here are the highlights:
- 55% of resources don’t specify a max-age value
- 46% of the resources without any max-age remained unchanged over a 2 week period
- some of the most popular resources on the Web are only cacheable for an hour or two
- 40-60% of daily users to your site don’t have your resources in their cache
- 30% of users have a full cache
- for users with a full cache, the median time to fill their cache is 4 hours of active browsing
Read on to understand the full story.
My kingdom for a max-age header
Many of the caching articles I’ve written address issues such as size & space limitations, bugs with less common HTTP headers, and outdated purging logic. These are critical areas to focus on. But the basic function of caching hinges on websites specifying caching headers for their resources. This is typically done using max-age in the Cache-Control response header. This example specifies that a response can be read from cache for 1 year:
Cache-Control: max-age=31536000
Since you’re reading this blog post you probably already use max-age, but the following chart from the HTTP Archive shows that 55% of resources don’t specify a max-age value. This translates to 45 of the average website’s 81 resources needing a HTTP request even for repeat visits.

Missing max-age != dynamic
Why do 55% of resources have no caching information? Having looked at caching headers across thousands of websites my first guess is lack of awareness – many website owners simply don’t know about the benefits of caching. An alternative explanation might be that many resources are dynamic (JSON, ads, beacons, etc.) and shouldn’t be cached. Which is the bigger cause – lack of awareness or dynamic resources? Luckily we can quantify the dynamicness of these uncacheable resources using data from the HTTP Archive.
The HTTP Archive analyzes the world’s top ~50K web pages on the 1st and 15th of the month and records the HTTP headers for every resource. Using this history it’s possible to go back in time and quantify how many of today’s resources without any max-age value were identical in previous crawls. The data for the chart above (showing 55% of resources with no max-age) was gathered on Feb 15 2012. The chart below shows the percentage of those uncacheable resources that were identical in the previous crawl on Feb 1 2012. We can go back even further and see how many were identical in both the Feb 1 2012 and the Jan 15 2012 crawls. (The HTTP Archive doesn’t save response bodies so the determination of “identical” is based on the resource having the exact same URL, Last-Modified, ETag, and Content-Length.)

46% of the resources without any max-age remained unchanged over a 2 week period. This works out to 21 resources per page that could have been read from cache without any HTTP request but weren’t. Over a 1 month period 38% are unchanged – 17 resources per page.
This is a significant missed opportunity. Here are some popular websites and the number of resources that were unchanged for 1 month but did not specify max-age:
- http://www.toyota.jp/ – 172 resources without max-age & unchanged for 1 month
- http://www.sfgate.com/ – 133
- http://www.hasbro.com/ – 122
- http://www.rakuten.co.jp/ – 113
- http://www.ieee.org/ – 97
- http://www.elmundo.es/ – 80
- http://www.nih.gov/ – 76
- http://www.frys.com/ – 68
- http://www.foodnetwork.com/ – 66
- http://www.irs.gov/ – 58
- http://www.ca.gov/ – 53
- http://www.oracle.com/ – 52
- http://www.blackberry.com/ – 50
Recalling that “the fastest HTTP request is the one not made”, this is a lot of unnecessary HTTP traffic. I can’t prove it, but I strongly believe this is not intentional – it’s just a lack of awareness. The chart below reinforces this belief – it shows the percentage of resources (both cacheable and uncacheable) that remain unchanged starting from Feb 15 2012 and going back for one year.

The percentage of resources that are unchanged is nearly the same when looking at all resources as it is for only uncacheable resources: 44% vs. 46% going back 2 weeks and 35% vs. 38% going back 1 month. Given this similarity in “dynamicness” it’s likely that the absence of max-age has nothing to do with the resources themselves and is instead caused by website owners overlooking this best practice.
3rd party content
If a website owner doesn’t make their resources cacheable, they’re just hurting themselves (and their users). But if a 3rd party content provider doesn’t have good caching behavior it impacts all the websites that embed that content. This is both bad a good. It’s bad in that one uncacheable 3rd party resource can impact multiple sites. The good part is that shifting 3rd party content to adopt good caching practices also has a magnified effect.
So how are we doing when it comes to caching 3rd party content? Below is a list of the top 30 most-used resources according to the HTTP Archive. These are the resources that were used the most across the world’s top 50K web pages. The max-age value (in hours) is also shown.
- http://www.google-analytics.com/ga.js (2 hours)
- http://ssl.gstatic.com/s2/oz/images/stars/po/Publisher/sprite2.png (8760 hours)
- http://pagead2.googlesyndication.com/pagead/js/r20120208/r20110914/show_ads_impl.js (336 hours)
- http://pagead2.googlesyndication.com/pagead/render_ads.js (336 hours)
- http://pagead2.googlesyndication.com/pagead/show_ads.js (1 hour)
- https://apis.google.com/_/apps-static/_/js/gapi/gcm_ppb,googleapis_client,plusone/[…] (720 hours)
- http://pagead2.googlesyndication.com/pagead/osd.js (24 hours)
- http://pagead2.googlesyndication.com/pagead/expansion_embed.js (24 hours)
- https://apis.google.com/js/plusone.js (1 hour)
- http://googleads.g.doubleclick.net/pagead/drt/s?safe=on (1 hour)
- http://static.ak.fbcdn.net/rsrc.php/v1/y7/r/ql9vukDCc4R.png (3825 hours)
- http://connect.facebook.net/rsrc.php/v1/yQ/r/f3KaqM7xIBg.swf (164 hours)
- https://ssl.gstatic.com/s2/oz/images/stars/po/Publisher/sprite2.png (8760 hours)
- https://apis.google.com/_/apps-static/_/js/gapi/googleapis_client,iframes_styles[…] (720 hours)
- http://static.ak.fbcdn.net/rsrc.php/v1/yv/r/ZSM9MGjuEiO.js (8742 hours)
- http://static.ak.fbcdn.net/rsrc.php/v1/yx/r/qP7Pvs6bhpP.js (8699 hours)
- https://plusone.google.com/_/apps-static/_/ss/plusone/[…] (720 hours)
- http://b.scorecardresearch.com/beacon.js (336 hours)
- http://static.ak.fbcdn.net/rsrc.php/v1/yx/r/lP_Rtwh3P-S.css (8710 hours)
- http://static.ak.fbcdn.net/rsrc.php/v1/yA/r/TSn6F7aukNQ.js (8760 hours)
- http://static.ak.fbcdn.net/rsrc.php/v1/yk/r/Wm4bpxemaRU.js (8702 hours)
- http://static.ak.fbcdn.net/rsrc.php/v1/yZ/r/TtnIy6IhDUq.js (8699 hours)
- http://static.ak.fbcdn.net/rsrc.php/v1/yy/r/0wf7ewMoKC2.css (8699 hours)
- http://static.ak.fbcdn.net/rsrc.php/v1/yO/r/H0ip1JFN_jB.js (8760 hours)
- http://platform.twitter.com/widgets/hub.1329256447.html (87659 hours)
- http://static.ak.fbcdn.net/rsrc.php/v1/yv/r/T9SYP2crSuG.png (8699 hours)
- http://platform.twitter.com/widgets.js (1 hour)
- https://plusone.google.com/_/apps-static/_/js/plusone/[…] (720 hours)
- http://pagead2.googlesyndication.com/pagead/js/graphics.js (24 hours)
- http://s0.2mdn.net/879366/flashwrite_1_2.js (720 hours)
There are some interesting patterns.
- simple URLs have short cache times – Some resources have very short cache times, e.g., ga.js (1), show_ads.js (5), and twitter.com/widgets.js (27). Most of the URLs for these resources are very simple (no querystring or URL “fingerprints”) because these resource URLs are part of the snippet that website owners paste into their page. These “bootstrap” resources are given short cache times because there’s no way for the resource URL to be changed if there’s an emergency fix – instead the cached resource has to expire in order for the emergency update to be retrieved.
- long URLs have long cache times – Many 3rd party “bootstrap” scripts dynamically load other resources. These code-generated URLs are typically long and complicated because they contain some unique fingerprinting, e.g., http://pagead2.googlesyndication.com/pagead/js/r20120208/r20110914/show_ads_impl.js (3) and http://platform.twitter.com/widgets/hub.1329256447.html (25). If there’s an emergency change to one of these resources, the fingerprint in the bootstrap script can be modified so that a new URL is requested. Therefore, these fingerprinted resources can have long cache times because there’s no need to rev them in the case of an emergency fix.
- where’s Facebook’s like button? – Facebook’s like.php and likebox.php are also hugely popular but aren’t in this list because the URL contains a querystring that differs across every website. Those resources have an even more aggressive expiration policy compared to other bootstrap resources – they use
no-cache, no-store, must-revalidate. Once the like[box] bootstrap resource is loaded, it loads the other required resources: lP_Rtwh3P-S.css (19), TSn6F7aukNQ.js (20), etc. Those resources have long URLs and long cache times because they’re generated by code, as explained in the previous bullet. - short caching resources are often async – The fact that bootstrap scripts have short cache times is good for getting emergency updates, but is bad for performance because they generate many Conditional GET requests on subsequent requests. We all know that scripts block pages from loading, so these Conditional GET requests can have a significant impact on the user experience. Luckily, some 3rd party content providers are aware of this and offer async snippets for loading these bootstrap scripts mitigating the impact of their short cache times. This is true for ga.js (1), plusone.js (9), twitter.com/widgets.js (27), and Facebook’s like[box].php.
These extremely popular 3rd party snippets are in pretty good shape, but as we get out of the top widgets we quickly find that these good caching patterns degrade. In addition, more 3rd party providers need to support async snippets.
Cache sizes are too small
In January 2007 Tenni Theurer and I ran an experiment at Yahoo! to estimate how many users had a primed cache. The methodology was to embed a transparent 1×1 image in the page with an expiration date in the past. If users had the expired image in their cache the browser would issue a Conditional GET request and receive a 304 response (primed cache). Otherwise they’d get a 200 response (empty cache). I was surprised to see that 40-60% of daily users to the site didn’t have the site’s resources in their cache and 20% of page views were done without the site’s resources in the cache.

Numerous factors contribute to this high rate of unique users missing the site’s resources in their cache, but I believe the primary reason is small cache sizes. Browsers have increased the size of their caches since this experiment was run, but not enough. It’s hard to test browser cache size. Blaze.io’s article Understanding Mobile Cache Sizes shows results from their testing. Here are the max cache sizes I found for browsers on my MacBook Air. (Some browsers set the cache size based on available disk space, so let me mention that my drive is 250 GB and has 54 GB available.) I did some testing and searching to find max cache sizes for my mobile devices and IE.
- Chrome: 320 MB
- Internet Explorer 9: 250 MB
- Firefox 11: 830 MB (shown in about:cache)
- Opera 11: 20 MB (shown in Preferences | Advanced | History)
- iPhone 4, iOS 5.1: 30-35 MB (based on testing)
- Galaxy Nexus: 18 MB (based on testing)
I’m surprised that Firefox 11 has such a large cache size – that’s almost close to what I want. All the others are (way) too small. 18-35 MB on my mobile devices?! I have seven movies on my iPhone – I’d gladly trade Iron Man 2Â (1.82 GB) for more cache space.
Caching in the real world
In order to justify increasing browser cache sizes we need some statistics on how many real users overflow their cache. This topic came up at last month’s Velocity Summit where we had representatives from Chrome, Internet Explorer, Firefox, Opera, and Silk. (Safari was invited but didn’t show up.) Will Chan from the Chrome team (working on SPDY) followed-up with this post on Chromium cache metrics from Windows Chrome. These are the most informative real user cache statistics I’ve ever seen. I strongly encourage you to read his article.
Some of the takeaways include:
- ~30% of users have a full cache (capped at 320 MB)
- for users with a full cache, the median time to fill their cache is 4 hours of active browsing (20 hours of clock time)
- 7% of users clear their cache at least once per week
- 19% of users experience “fatal cache corruption” at least once per week thus clearing their cache
The last stat about cache corruption is interesting – I appreciate the honesty. The IE 9 team experienced something similar. In IE 7&8 the cache was capped at 50 MB based on tests showing increasing the cache size didn’t improve the cache hit rate. They revisited this surprising result in IE9 and found that larger cache sizes actually did improve the cache hit rate:
In IE9, we took a much closer look at our cache behaviors to better understand our surprising finding that larger caches were rarely improving our hit rate. We found a number of functional problems related to what IE treats as cacheable and how the cache cleanup algorithm works. After fixing these issues, we found larger cache sizes were again resulting in better hit rates, and as a result, we’ve changed our default cache size algorithm to provide a larger default cache.
Will mentions that Chrome’s 320 MB cap should be revisited. 30% seems like a low percentage for full caches, but could be accounted for by users that aren’t very active and active users that only visit a small number of websites (for example, just Gmail and Facebook). If possible I’d like to see these full cache statistics correlated with activity. It’s likely that user who account for the biggest percentage of web visits are more likely to have a full cache, and thus experience slower page load times.
Next steps
First, much of the data for this post came from the HTTP Archive, so I’d like to thank our sponsors: Google, Mozilla, New Relic, O’Reilly Media, Etsy, Strangeloop, dynaTrace Software, and Torbit.
The data presented here suggest a few areas to focus on:
Website owners need to increase their use of a Cache-Control max-age, and the max-age times need to be longer. 38% of resources were unchanged over a 1 month period, and yet only 11% of resources have a max-age value that high. Most resources, even if they change, can be refreshed by including a fingerprint in the URL specified in the HTML document. Only bootstrap scripts from 3rd parties should have short cache times (hours). Truly dynamic responses (JSON, etc.) should specify must-revalidate. A year from now rather than seeing 55% of resources without any max-age value we should see 55% cacheable for a month or more.
3rd party content providers need wider adoption of the caching and async behavior shown by the top Google, Twitter, and Facebook snippets.
Browser developers stand to bring the biggest improvements to caching. Increasing cache sizes is a likely win, especially for mobile devices. Data correlating cache sizes and user activity is needed. More intelligence around purging algorithms, such as IE 9’s prioritization based on mime type, will help when the cache fills up. More focus on personalization (what are the sites I visit most often?) would also create a faster user experience when users go to their favorite websites.
It’s great that the number of resources with caching headers grew 10% over the last year, but that just isn’t enough progress. We should really expect to double the number of resources that can be read from cache over the coming year. Just think about all those HTTP requests that can be avoided!
JavaScript Performance
Last night I spoke at the San Francisco JavaScript Meetup. I gave a brand new talk called JavaScript Performance that focuses on script loading and async snippets. The snippet example I chose was the Google Analytics async snippet. The script-loading part of that snippet is only six lines, but a lot of thought and testing went into it. It’s a great prototype to use if you’re creating your own async snippet. I’ll tweet if/when the video of my talk comes out, but in the meantime the slides (Slideshare, pptx) do a good job of relaying the information.
There are two new data points from the presentation that I want to call out in this blog post.
Impact of JavaScript
The presentation starts by suggesting that JavaScript is typically the #1 place to look for making a website faster. My anecdotal experience supports this hypothesis, but I wanted to try to do some quantitative verification. As often happens, I turned to WebPagetest.
I wanted to test the Alexa Top 100 URLs with and without JavaScript. To load these sites withOUT JavaScript I used WebPagetest’s “block” feature. I entered “.js” which tells WebPagetest to ignore every HTTP request with a URL that contains that string. Each website was loaded three times and the median page load time was recorded. I then found the median of all these median page load times.
The median page load with JavaScript is 3.65 seconds. Without JavaScript the page load time drops to 2.487 seconds – a 31% decrease. (Here’s the data in WebPagetest: with JavaScript, without JavaScript.) It’s not a perfect analysis: Some script URLs don’t contain “.js” and inline script blocks are still executed. I think this is a good approximation and I hope to do further experiments to corroborate this finding.

Async Execution Order & Onload
The other new infobyte has to do with the async=true line from the GA async snippet. The purpose of this line is to cause the ga.js script to not block other async scripts from being executed. It turns out that some browsers preserve the execution order of scripts loaded using the insertBefore technique, which is the technique used in the GA snippet:
ga.type = ‘text/javascript’;
ga.async = true;
ga.src = (‘https:’ == document.location.protocol ? ‘https://ssl’ : ‘http://www’) + ‘.google-analytics.com/ga.js’;
var s = document.getElementsByTagName(‘script’)[0];
s.parentNode.insertBefore(ga, s);
Preserving execution order of async scripts makes the page slower. If the first async script takes a long time to download, all the other async scripts are blocked from executing, even if they download sooner. Executing async scripts immediately as they’re downloaded results in a faster page load time. I knew old versions of Firefox had this issue, and setting async=true fixed the problem. But I wanted to see if any other browsers also preserved execution order of async scripts loaded this way, and whether setting async=true worked.
To answer these questions I created a Browserscope user test called Async Script Execution Order. I tweeted the test URL and got 348 results from 60+ different browsers. (Thanks to all the people that ran the test! I still need results from more mobile browsers so please run the test if you have a browser that’s not covered.) Here’s a snapshot of the results:

The second column shows the results of loading two async scripts with the insertBefore pattern AND setting async=true. The third column shows the results if async is NOT set to true. Green means the scripts execute immediately (good) and red indicates that execution order is preserved (bad).
The results show that Firefox 3.6, OmniWeb 622, and all versions of Opera preserve execution order. Setting async=true successfully makes the async scripts execute immediately in Firefox 3.6 and OmniWeb 622, but not in Opera. Although this fix only applies to a few browsers, its small cost makes it worthwhile. Also, if we get results for more mobile browsers I would expect to find a few more places where the fix is necessary.
I also tested whether these insertBefore-style async scripts block the onload event. The results, shown in the fourth column, are mixed if we include older browsers, but we see that newer browsers generally block the onload event when loading these async scripts – this is true in Android, Chrome, Firefox, iOS, Opera, Safari, and IE 10. This is useful to know if you wonder why you’re still seeing long page load times even after adopting async script loading. It also means that code in your onload handler can’t reliably assume async scripts are loaded because of the many browsers out there that do not block the onload event, including IE 6-9.
And a final shout out to the awesomeness of the Open Source community that makes tools like WebPagetest and Browserscope available – thanks Pat and Lindsey!
(lack of) Caching for iPhone Home Screen Apps
Yesterday’s post, Unexpected Reloads in WebKit, revealed an interesting behavior that affects caching in Safari:
When you load the same URL back-to-back in Safari, the second load is treated the same as hitting Reload.
This is bad for performance because the browser issues a Conditional GET request for each resource instead of using the cached resource.
It’s important to be aware of this behavior when testing the primed cache experience in Safari, so web performance engineers should take note. However, in the real world it’s unlikely this behavior has much of an impact on desktop users. Here’s the table from yesterday’s post that shows how this Reload-like behavior is triggered when re-requesting a page:
| way of loading URL again | like Reload? |
|---|---|
| hit RETURN in location field | yes |
| delete URL and type it again | yes |
| launch same URL via bookmark | yes |
| click link to same URL | yes |
| go to another URL then type 1st URL again | no |
| modify querystring | no |
| enter URL in a new tab | no |
| Table 1. Triggering reload behavior in Safari | |
It’s possible that real world users might type the same URL or open the same bookmark two times in a row in the same tab, but it probably doesn’t happen that often. So what’s the big deal?
So what’s the big deal?
Whenever I see strange performance behavior I think about where that behavior might have a significant impact. Is there any place where this back-to-back Safari Reload behavior could have a significant impact? A comment from yesterday’s post hints at the answer:
Why is this article named “Unexpected Reloads in WebKit�
Chrome is based on Webkit and doesn’t has same issue. Perhaps it would be less confusing to name it “Unexpected Reloads in Safariâ€.
Other people gave me the same feedback on the backchannel – why did I say “WebKit” instead of “Safari”.
Here’s why: WebKit is used in a lot of browsers. Whenever I see a bug (or a feature) in one popular WebKit-based browser I wonder if it exists in others. The main WebKit-based browsers I focus on are Chrome, Safari, Android, and iPhone. As soon as I noticed this behavior in Safari my next step was to conduct the same tests in Chrome, Android, and iPhone. As the commenter noted, this unexpected Reload behavior does not happen in Chrome. And it does not happen on Android (tested on my Nexus S). But it does happen on iPhone.
While it’s true that iPhone users are unlikely to manually launch the same URL twice-in-a-row in the same tab, there is a situation when this happens automatically: when launching home screen apps.
Home screen apps are a powerful feature on iPhone and Android that allow users to save URLs to the home screen and launch them similar to native apps. Unfortunately, launching home screen apps on the iPhone triggers something similar to the Reload behavior we see in Safari – where resources aren’t read from cache and instead generate extra HTTP requests. Let’s take a look at a few examples of home screen apps, starting with simple to more complex.
Amazon: simple URL
Typing http://www.amazon.com/ into the iPhone browser displays a version of Amazon’s front page that is customized for mobile – there’s less content, the images are smaller, etc. However, there is not a prompt to save the URL to the home screen. We can do that anyway using the arrow function key at the bottom of the screen and selecting “Add to Home Screen”.
If you’ve used home screen apps you might have noticed that they always open in the same browser tab. Let’s run a little test to confirm this:
- Click the Amazon home screen icon. This opens Amazon in mobile Safari.
- Open another tab by clicking the “pages” function key and opening a “New Page”. Enter some non-Amazon URL in this new tab, for example http://fast.stevesouders.com/ (a very lightweight page I use for testing). At this point we have at least two tabs, one with Amazon and one with fast.stevesouders.com, and we’re looking at the fast.stevesouders.com tab.
- Go back to the home screen and click the Amazon icon again.
- Note that you’re taken back into mobile Safari to the first tab that contains Amazon.
We just opened the exact same URL back-to-back in the same tab. We didn’t do it intentionally – that’s the default behavior for iPhone home screen apps. Here’s a waterfall chart for this test. (You can view an interactive waterfall by loading the HAR file in pcapperf.)
![]()
The home screen app URL is http://www.amazon.com/gp/aw/h.html/187-9233150-9797455. The first time the home screen app is launched starts at the top with 187-9233150-9797455. Since the cache was empty all the subsequent resources have 200 responses. There are some 404s for icons followed by the request for fast.stevesouders.com.
The second launch of the Amazon home screen app (187-9233150-9797455 below fast.stevesouders.com) is where it gets interesting. When the Amazon home screen app is launched the second time, a Conditional GET request is made for all of the resources even though these resources are in the cache with a future expiration date.
All of the resources that are re-requested have an expiration date more than 10 years in the future. For example, the response headers for title_gradient._V233984477_.png are:
content-length: 291
expires: Tue, 06 May 2031 21:44:21 GMT
last-modified: Mon, 10 Aug 2009 11:50:45 GMT
cache-control: max-age=626560472
date: Wed, 29 Jun 2011 01:09:49 GMT
content-type: image/png
We know it was cached because when the Amazon home screen app is launched the second time the Conditional GET request for title_gradient._V233984477_.png has an If-Modified-Since header that contains the last-modified date in the initial response:
if-modified-since: Mon, 10 Aug 2009 11:50:45 GMT
It appears that we’ve stumbled into the Reload-like behavior we saw in Safari on the desktop. Further evidence of this is if you launch the home screen app, then type a new URL over the Amazon URL, and launch the home screen app again the resources are read from cache instead of generating numerous Conditional GET requests. (Load this HAR file in pcapperf to see for yourself.)
Untappd: full screen app
Amazon was a simple home screen app – really just a bookmark on the home screen. Developers can do more with home screen apps to make them launch and look like native apps. As described in Apple’s How-To’s for Safari on iPhone, various parts of the home screen app user experience are customizable including the home screen icon, viewport, and zooming and scaling. Developers can also have their home screen app launch in “full screen mode” by hiding the Safari UI components, including the status bar and location bar. In this situation, every time the home screen app is launched it uses the same “tab” with the exact same URL – thus triggering the Reload behavior.
Let’s have a look at Untappd on the iPhone. The first time you navigate to http://untappd.com/ in iPhone’s browser you get a suggestion to add the web app to the home screen:

After which you’ll have a customized Untappd home screen icon:
Now let’s investigate how caching works for this home screen app. We start by clearing the cache then launching the home screen app. You’ll notice there is no location bar or other Safari controls. Then we go back to the home screen and launch the Untappd home screen app again. The waterfall chart is shown below. (Here’s the HAR file.)
![]()
The first time the Untappd home screen app is launched it loads seven HTTP requests. Three of these resources are cacheable: jquery.min.js (1 year), gears_init.js (1 hour), and ga.js (1 day). Loader.gif and ajax-loader.png don’t have a future expiration date, but they do have Last-Modified and ETag response headers that could be used in a Conditional GET request.
But we see that the second time Untappd is launched from the home screen, all of the resources are re-requested. To make matters worse, none of these are Conditional GET requests, so a 200 status code is returned with the full response body.
The punchline
It’s unfortunate that home screen apps suffer from this bad caching behavior on the iPhone. Thankfully, there is a workaround: application cache. I ran similar tests on other home screen apps that use application cache. The resources listed in the CACHE: section of the manifest file were used on the iPhone without generating Conditional GET requests.
I feel bad about recommending the use of application cache. This is an issue with the browser cache on mobile Safari (and to a lesser degree on desktop Safari) that should be fixed. It’s a significant amount of work for developers to adopt application cache. The plus side is that doing so achieves the ability to work offline.
After this lengthy analysis and numerous waterfalls, here’s the punchline in a nutshell:
Home screen apps on iPhone are slower because resources are re-requested even though they should be read from cache. Use application cache to avoid this performance problem.
Unexpected Reloads in WebKit
People who work on web performance often need to load the same URL over and over again. Furthermore, they need to do this while simulating a real user’s empty cache experience and primed cache experience. When I want to analyze the empty cache experience the flow is simple: go to about:blank, clear the browser cache, enter the URL, and hit RETURN.
But what’s the right way to fetch a page repeatedly when analyzing the primed cache experience?
The main goal when testing the primed cache version of a page is to see which resources are read from cache. The goal for better performance is to cache as many responses as possible thus reducing the number of requests made when the cache is primed. If a resource has an expiration date in the future, the browser uses the cached version and doesn’t have to make an HTTP request resulting in a faster page. If a resource is expired (the expiration date is in the past) the browser issues a Conditional GET request using the If-Modified-Since and If-None-Match request headers. If the resource hasn’t changed then the server returns a simple 304 status code with no body. This is faster (because there’s no response body) but still takes time to do the HTTP request. (See my article on ETags for examples of IMS and INM.)
One way to re-request a page is to hit the Reload button, but this doesn’t give an accurate portrayal of the typical primed cache user experience. Hitting Reload causes the browser to always make an IMS/INM request for resources in the page, even for cached resources that have an expiration date in the future. Normally these resources would be used without generating an HTTP request. Although users do occasionally hit the Reload button it’s more likely that they’ll navigate to a page via a link or the location field, both of which avoid the time consuming Conditional GET requests generated when hitting Reload.
The technique I adopted years ago for re-requesting a page when testing the primed cache is to click in the location field and hit RETURN. That’s a fine approach in IE, Firefox, Chrome, and Opera, but not in Safari. Let’s investigate why.
hitting RETURN in the location field
I’m using Untappd as an example. Untappd has 68 requests when loaded on the desktop. Figure 1 shows the waterfall chart for the first 31 requests when loaded in Firefox 4 with an empty cache:

- Figure 1. untappd.com – Firefox 4 – empty cache
Most of the resources shown in Figure 1 have an expiration date in the future and therefore won’t generate an HTTP request if the user has a primed cache. To test that I click in the location field and hit RETURN. The resulting waterfall chart is shown in Figure 2. Sure enough the number of HTTP requests drops from 68 to 4!

- Figure 2. untappd.com – Firefox 4 – primed cache
If you repeat this experiment in Chrome, Firefox, Internet Explorer, and Opera you’ll get similar results – empty cache generates 68 requests, primed cache generates 4 requests. However, the result is very different in Safari 5. It’s important to understand why.
Safari is different
This test shows that Untappd has done a good job of optimizing the primed cache experience – the number of HTTP requests made by the browser drops from 68 to 4. Running the same test in Safari 5 produces different results. Clearing the cache and loading untappd.com in Safari 5 loads 68 HTTP requests – just as before. To test the primed cache experience we click in the location field and hit RETURN. Instead of only 4 requests there are 68 HTTP requests.
Why are there 64 more HTTP requests in Safari 5 for the primed cache test? Looking at the HTTP request headers we see that these are all Conditional GET requests. Let’s use http://ajax.googleapis.com/ajax/libs/jquery/1.4.2/jquery.min.js as the example (it’s the 8th request in Figure 1). In the empty cache scenario the HTTP request headers are:
Accept: */*
Cache-Control: max-age=0
Referer: http://untappd.com/
User-Agent: Mozilla/5.0 (Macintosh; [snip...] Safari/533.20.27
The HTTP status code returned for that empty cache request is 200 OK.
In the primed cache test when we hit RETURN in the location field we see that the request for jquery.min.js contains an extra header:
Accept: */*
Cache-Control: max-age=0
If-Modified-Since: Mon, 15 Feb 2010 23:30:12 GMT
Referer: http://untappd.com/
User-Agent: Mozilla/5.0 (Macintosh; [snip...] Safari/533.20.27
The header that’s added in the primed cache test is If-Modified-Since. This is a Conditional GET request. The HTTP status code that’s returned is 304 Not Modified. Even though all I did was hit RETURN in the location field, Safari treated that like hitting the Reload button.
unexpected “reload” in Webkit
Unlike other browsers, Safari 5 treats hitting RETURN in the location field the same as clicking the Reload button. When else does this happen? Assuming you’ve loaded a URL in Safari and are looking at that page, this table lists various ways to load that URL again. For each technique I show whether loading the URL this way generates extra Conditional GET requests similar to clicking Reload.
| way of loading URL again | like Reload? |
|---|---|
| hit RETURN in location field | yes |
| delete URL and type it again | yes |
| launch same URL via bookmark | yes |
| click link to same URL | yes |
| go to another URL then type 1st URL again | no |
| modify querystring | no |
| enter URL in a new tab | no |
| Table 1. Triggering reload behavior in Safari | |
This black box testing indicates that whenever the same URL is loaded back-to-back in the same tab, Safari 5 treats it as a Reload. I was describing this behavior to Jay Freeman (saurik) at Foo Camp. He pointed me to this code from WebCore:
else if (sameURL)
   // Example of this case are sites that reload the same URL with a different cookie
   // driving the generated content, or a master frame with links that drive a target
   // frame, where the user has clicked on the same link repeatedly.
   m_loadType = FrameLoadTypeSame;
Searching in that same file for FrameLoadTypeSame we find this code:
case FrameLoadTypeReload:
case FrameLoadTypeReloadFromOrigin:
case FrameLoadTypeSame:
case FrameLoadTypeReplace:
   history()->updateForReload();
   m_client->transitionToCommittedForNewPage();
   break;
This code doesn’t account for the behavior, but it does show that FrameLoadTypeSame and FrameLoadTypeReload are treated as similar cases in this context, and perhaps that’s why IMS/INM requests are generated.
One important takeaway from this is: don’t hit RETURN in the location field to test primed cache experience in Safari. Instead, go to a different URL and then type the test URL in the location field, or open a new tab and type the URL.
There’s a second more important takeaway from this. I’ll cover that in tomorrow’s post. If you know the answer, please don’t spoil it. Oh what the heck – if you think you know the answer go ahead and add a comment.
Evolution of Script Loading
Velocity China starts tomorrow morning. I’m kicking it off with a keynote and am finishing up my slides. I’ll be talking about progressive enhancement and smart script loading. As I reviewed the slides it struck me how the techniques for loading external scripts have changed significantly in the last few years. Let’s take a look at what we did, where we are now, and try to see what the future might be.
Scripts in the HEAD
Just a few years ago most pages, even for the top websites, loaded their external scripts with HTML in the HEAD of the document:
<head> <script src=â€core.js†type=â€text/javascriptâ€></script> <script src=â€more.js†type=â€text/javascriptâ€></script> </head>
Developers in tune with web performance best practices cringe when they see scripts loaded this way. We know that older browsers (now that’s primarily Internet Explorer 6 & 7) load scripts sequentially. The browser downloads core.js and then parses and executes it. Then it does the same with more.js – downloads the script and then parses and executes it.
In addition to loading scripts sequentially, older browsers block other downloads until this sequential script loading phase is completed. This means there may be a significant delay before these browsers even start downloading stylesheets, images, and other resources in the page.
These download issues are mitigated in newer browsers (see my script loading roundup). Starting with IE 8, Firefox 3.6, Chrome 2, and Safari 4 scripts generally get downloaded in parallel with each other as well as with other types of resources. I say “generally†because there are still quirks in how browsers perform this parallel script loading. In IE 8 and 9beta, for example, images are blocked from being downloaded during script downloads (see this example). In a more esoteric use case, Firefox 3 loads scripts that are document.written into the page sequentially rather than in parallel.
Then there’s the issue with rendering being blocked by scripts: any DOM elements below a SCRIPT tag won’t be rendered until that script is finished loading. This is painful. The browser has already downloaded the HTML document but none of those Ps, DIVs, and ULs get shown to the user if there’s a SCRIPT above them. If you put the SCRIPT in the document HEAD then the entire page is blocked from rendering.
There are a lot of nuances in how browsers load scripts especially with the older browsers. Once I fully understood the impact scripts had on page loading I came up with my first recommendation to improve script loading:
Move Scripts to the Bottom
Back in 2006 and 2007 when I started researching faster script loading, all browsers had the same problems when it came to loading scripts:
- Scripts were loaded sequentially.
- Loading a script blocked all other downloads in the page.
- Nothing below the SCRIPT was rendered until the script was done loading.
The solution I came up with was to move the SCRIPT tags to the bottom of the page.
... <script src=â€core.js†type=â€text/javascriptâ€></script> <script src=â€more.js†type=â€text/javascriptâ€></script> </body>
This isn’t always possible, for example, scripts for ads that do document.write can’t be moved – they have to do their document.write in the exact spot where the ad is supposed to appear. But many scripts can be moved to the bottom of the page with little or no work. The benefits are immediately obvious – images download sooner and the page renders more quickly. This was one of my top recommendations in High Performance Web Sites. Many websites adopted this change and saw the benefits.
Load Scripts Asynchronously
Moving scripts to the bottom of the page avoided some problems, but other script loading issues still existed. During 2008 and 2009 browsers still downloaded scripts sequentially. There was an obvious opportunity here to improve performance. Although it’s true that scripts (often) need to be executed in order, they don’t need to be downloaded in order. They can be downloaded in any order – as long as the browser preserves the original order of execution.
Browser vendors realized this. (I like to think that I had something to do with that.) And newer browsers (starting with IE8, Firefox 3.6, Chrome 2, and Safari 4 as mentioned before) started loading scripts in parallel. But back in 2008 & 2009 sequential script loading was still an issue. I was analyzing MSN.com one day and noticed that their scripts loaded in parallel – even though this was back in the Firefox 2.0 days. They were using the Script DOM Element approach:
var se = document.createElement("script");
se.src = "core.js";
document.getElementsByTagName("head")[0].appendChild(se);
I’ve spent a good part of the last few years researching asynchronous script loading techniques like this. These async techniques (summarized in this blog post with full details in chapter 4 of Even Faster Web Sites) achieve parallel script loading in older browsers and avoid some of the quirks in newer browsers. They also mitigate the issues with blocked rendering: when a script is loaded using an async technique the browser charges ahead and renders the page while the script is being downloaded. This example has a script in the HEAD that’s loaded using the Script DOM Element technique. This script is configured to take 4 seconds to download. When you load the URL you’ll see the page render immediately, proving that rendering proceeds when scripts are loaded asynchronously.
Increased download parallelism and faster rendering – what more could you want? Well…
Async + On-demand Execution
Loading scripts asynchronously speeds up downloads (more parallelism) and rendering. But – when the scripts arrive at the browser rendering stops and the browser UI is locked while the script is parsed and executed. There wouldn’t be any room for improvement here if all that JavaScript was needed immediately, but websites don’t use all the code that’s downloaded – at least not right away. The Alexa US Top 10 websites download an average of 229 kB of JavaScript (compressed) but only execute 29% of those functions by the time the load event fires. The other 71% of code is cruft, conditional blocks, or most likely DHTML and Ajax functionality that aren’t used to render the initial page.
This discovery led to my recommendation to split the initial JavaScript download into the code needed to render the page and the code that can be loaded later for DHTML and Ajax features. (See this blog post or chapter 3 of EFWS.) Websites often load the code that’s needed later in the window’s onload handler. The Gmail Mobile team found wasn’t happy with the UI locking up when that later code arrived at the browser. After all, this DHTML/Ajaxy code might not even be used. They’re the first folks I saw who figured out a way to separate the download phase from the parse-execute phase of script loading. They did this by wrapping all the code in a comment, and then when the code is needed removing the comment delimiters and eval’ing. Gmail’s technique uses iframes so requires changing your existing scripts. Stoyan has gone on to explore using image and object tags to download scripts without the browser executing them, and then doing the parse-execute when the code is needed.
What’s Next?
Web pages are getting more complex. Advanced developers who care about performance need more control over how the page loads. Giving developers the ability to control when an external script is parsed and executed makes sense. Right now it’s way too hard. Luckily, help is on the horizon. Support for LINK REL=”PREFETCH” is growing. This provides a way to download scripts while avoiding parsing and execution. Browser vendors need to make sure the LINK tag has a load event so developers can know whether or not the file has finished downloading. Then the file that’s already in the browser’s cache can be added asynchronously using the Script DOM Element approach or some other technique only when the code is actually needed.
We’re close to having the pieces to easily go to the next level of script loading optimization. Until all the pieces are there, developers on the cutting edge will have to do what they always do – work a little harder and stay on top of the latest best practices. For full control over when scripts are downloaded and when they’re parsed and executed I recommend you take a look at the posts from Gmail Mobile and Stoyan.
Based on the past few years I’m betting there are more improvements to script loading still ahead.
Render first. JS second.
Let me start with the takeaway point:
The key to creating a fast user experience in today’s web sites is to render the page as quickly as possible. To achieve this JavaScript loading and execution has to be deferred.
I’m in the middle of several big projects so my blogging rate is down. But I got an email today about asynchronous JavaScript loading and execution. I started to type up my lengthy response and remembered one of those tips for being more productive: “type shorter emails – no one reads long emails anyway”. That just doesn’t resonate with me. I like typing long emails. I love going into the details. But, I agree that an email response that only a few people might read is not the best investment of time. So I’m writing up my response here.
It took me months to research and write the “Loading Scripts Without Blocking” chapter from Even Faster Web Sites. Months for a single chapter! I wasn’t the first person to do async script loading – I noticed it on MSN way before I started that chapter – but that work paid off. There has been more research on async script loading from folks like Google, Facebook and Meebo. Most JavaScript frameworks have async script loading features – two examples are YUI and LABjs. And 8 of today’s Alexa Top 10 US sites use advanced techniques to load scripts without blocking: Google, Facebook, Yahoo!, YouTube, Amazon, Twitter, Craigslist(!), and Bing. Yay!
The downside is – although web sites are doing a better job of downloading scripts without blocking, once those scripts arrive their execution still blocks the page from rendering. Getting the content in front of the user as quickly as possible is the goal. If asynchronous scripts arrive while the page is loading, the browser has to stop rendering in order to parse and execute those scripts. This is the biggest obstacle to creating a fast user experience. I don’t have scientific results that I can cite to substantiate this claim (that’s part of the big projects I’m working on). But anyone who disables JavaScript in their browser can attest that sites feel twice as fast.
My #1 goal right now is to figure out ways that web sites can defer all JavaScript execution until after the page has rendered. Achieving this goal is going to involve advances from multiple camps – changes to browsers, new web development techniques, and new pieces of infrastructure. I’ve been talking this up for a year or so. When I mention this idea these are the typical arguments I hear for why this won’t work:
In response to this argument I point to Opera’s Delayed Script Execution feature. I encourage you to turn it on, surf around, and try to find a site that breaks. Even sites like Gmail and Facebook work! I’m sure there are some sites that have problems (perhaps that’s why this feature is off by default). But if some sites do have problems, how many sites are we talking about? And what’s the severity of the problems? We definitely don’t want errors, rendering problems, or loss of ad revenue. Even though Opera has had this feature for over two years (!), I haven’t heard much discussion about it. Imagine what could happen if significant resources focused on this problem.
What are the next steps?
- Browsers should look at Opera’s behavior and implement the SCRIPT ASYNC and DEFER attributes.
- Developers should adopt asynchronous script loading techniques and avoid rendering the initial page view with JavaScript on the client.
- Third party snippet providers, most notably ads, need to move away from document.write.
Redirect caching deep dive
I was talking to a performance guru today who considers redirects one of the top two performance problems impacting web pages today. (The other was document.write.) I agree redirects are an issue, so much so that I wrote a chapter on avoiding redirects in High Performance Web Sites. What makes matters worse is that, even though redirects are cacheable, most browsers (even the new ones) don’t cache them.
Another performance guru, Eric Lawrence, sent me an email last week pointing out how cookies, status codes, and response headers affect redirect caching. Even though there are a few redirect tests in Browserscope, they don’t test all of these conditions. I wanted a more thorough picture of the state of redirect caching across browsers.
The Redirect Caching Tests page provides a test harness for exercising different redirect caching scenarios.
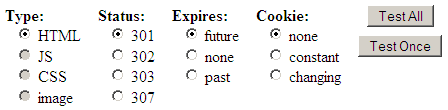
You can use the “Test Once” button to test a specific scenario, but if you choose “Test All” the harness runs through all the tests and offers to post the results (anonymously) to Browserscope. Here’s a snapshot of the results:
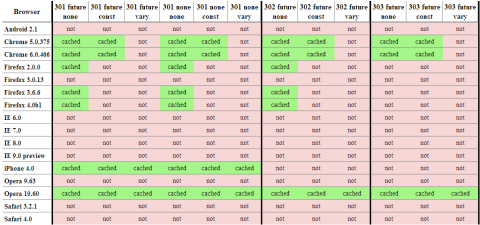
I realize you can’t read the results, but suffice it to say red is bad. If you click on the table you’ll go to the full results. They’re broken into two tables: redirects that should be cached, and redirects that should not be cached. For example, a 301 response with an expiration date in the future should be cached, but a 302 redirect with an expiration date in the past shouldn’t be cached. The official ruling can be found in RFC 2616. (Also, discussions Eric had with Mark Nottingham, chair of the Httpbis working group, indicate that 303 redirects with a future expiration date should be cached.)
Chrome, iPhone, and Opera 10.60 are doing the best job, but there’s still a lot of missed opportunities. IE 9 platform preview 3 still doesn’t cache any redirects, but Eric’s blog post, Caching Improvements in Internet Explorer 9, describes how that’ll be in the final version of IE9. If you use redirects that don’t change, make sure to use a 301 status code and set an expiration date in the future. That will ensure they’re cached in Chome, Firefox, iPhone, Opera, and IE9.
Please help out by running the test on your browser (especially mobile!) and contributing the results back to Browserscope so we can help browser vendors know what needs to be fixed.
Mobile cache file sizes
Mobile is big, but knowledge about how to make a mobile web site fast is lacking. The state of mobile web performance is in a similar place as desktop was six years ago when I started my performance deep dive. How many of us are happy with the speed of web pages on mobile? (I’m not.) How many of us know the top 10 best practices for building high performance mobile web sites? (I don’t.)
I’ve been focusing more on mobile in order to help build this set of best practices. Browserscope is a valuable resource since it measures all browsers, both mobile and desktop. The Network category for popular mobile browsers shows information about max connections per hostname, parallel script loading, redirect caching, and more. Since Browserscope’s data is crowdsourced it’s easy to get coverage on a wide variety of mobile devices. The table below shows the results from Browserscope for some popular mobile devices.

One thing I’ve wanted to measure on mobile is the browser’s cache. Caching on mobile devices is a cause for concern. In my experience a page I visited just a few minutes ago doesn’t seem to be cached when I visit it again. A few months ago I started creating tests for measuring the browser’s cache.
That’s why I was especially excited to see Ryan Grove’s post on Mobile Browser Cache Limits. I noticed his results were quite different from mine, so I commented on his blog post and invited him to contact me. Which he did! It’s great to find someone to collaborate with, especially when designing tests like this where another pair of eyes is a big help.
Ryan and I created a new test design. He’s deployed his under the name cachetest on GitHub. My implementation is called Max Cache File Size. I’m hosting it so you can run it immediately. I’ve integrated it with Browserscope as a User Test. Anyone who runs my hosted version has the option to post their results (anonymously) to Browserscope and contribute to building a repository for script cache sizes for all browsers.
Here’s a link to the Max Cache File Size results on Browserscope. A summary of the results with some other findings follows:
| Browser | Max Cached Script Size Same Session |
Cache Cross Lock/Unlock |
Cache Cross Power Cycle |
|---|---|---|---|
| Android 2.1 | 4 MB | yes | yes |
| Android 2.2 | 2 MB | yes | yes |
| iPad | 4 MB | yes | no |
| iPhone 3 | 4 MB | yes | no |
| iPhone 4 | 4 MB | yes | no |
| Palm Pre | 1 MB | yes | yes |
My Max Cache File Size test measures the largest script that’s cached in the same session (going from one page to another page). Many mobile devices reach the maximum size tested – 4MB. It’s interesting to see that in the recent upgrade from Android 2.1 to 2.2, the maximum cached script size drops from 4MB to 2MB. The Palm Pre registers at 320kB – much smaller than the others but large enough to handle many real world situations. Note that these sizes are the script’s uncompressed size.
Knowing the cache size that applies during a single session is valuable, but users often revisit pages after locking and unlocking their device, and some users might even power cycle their device between visits. Ryan and I manually tested a few devices under these scenarios – the results are shown in the previous table. Although results are mixed for the power cycling case, the cached items persist across lock/unlock. For me personally, this is the more typical case. (I only power cycle when I’m on the plane or need to reset the device.)
These results show that the 15 kB and 25 kB size limit warnings for a single resource are no longer a concern for mobile devices. However, even though the test went as high as 4 MB (uncompressed), I dearly hope you’re not even close to that size. (I saw similar results for stylesheets, but removed them from the automated test because stylesheets over ~1 MB cause problems on the iPhone.)
It’s great to have this data, and have it verified by different sources. But this is only testing the maximum size of a single script and stylesheet that can be cached. I believe the bigger issue for mobile is the maximum cache size. A few months ago I wrote a Call to improve browser caching. I wrote that in the context of desktop browsers, where I have visibility into the browser’s cache and available disk space. I think the size of mobile caches is even smaller. If you have information about the size of the browser cache on mobile devices, or tests to determine that, please share them in the comments below.
Finally, please run the Max Cache File Size test and add more data to the results.
Many thanks to Ryan Grove for working on this caching test – check out his updated post: Mobile Browser Cache Limits, Revisited. And thanks to Lindsey Simon for making Browserscope such a great framework for crowdsourcing browser performance data.