HTTP Archive New Leadership
I announced the HTTP Archive six years ago. Six years ago! It has exceeded my expectations and its value continues to grow. In order to expand the vision, I’ve asked Ilya Grigorik, Rick Viscomi, and Pat Meenan to take over leadership of the project.
The HTTP Archive is part of the Internet Archive. The code and data are open source. The project is funded by our generous sponsors: Google, Mozilla, New Relic, O’Reilly Media, Etsy, dynaTrace, Instart Logic, Catchpoint Systems, Fastly, SOASTA mPulse, and Hosting Facts.
From the beginning, Pat and WebPageTest made the HTTP Archive possible. Ilya and Rick will join Pat to make the HTTP Archive even better. A few of the current items on the agenda:
- Enrich the collected data during the crawl: detect JavaScript libraries in use on the page, integrate and capture LightHouse audits, feature counters, and so on.
- Build new analysis pipelines to extract more information from the past crawls
- Provide better visualizations and ways to explore the gathered data
- Improve code health and overall operation of the full pipeline
- … and lots more – please chime in with your suggestions!
Since its inception, the HTTP Archive has become the goto source for objective, documented data about how the Web is built. Thanks to Ilya, that data was brought to BigQuery so the community can perform their own queries and follow-on research. It’s a joy to see the data and graphs from HTTP Archive used on a daily basis in tech articles, blog posts, tweets, etc.
I’m excited about this next phase for the HTTP Archive. Thank you to everyone who helped get the HTTP Archive to where it is today. (Especially Stephen Hay for our awesome logo!) Now let’s make the HTTP Archive even better!
Velocity Farewell
Velocity Origin Story
In 2007, my first book, High Performance Web Sites, was selling very well. That, plus the launch of YSlow, brought more attention to web performance. As a result, Jon Jenkins invited me to give a tech talk at Amazon. Afterward, he, John Rauser, and I, plus a few other performance-minded folk, had a great dinner and spirited discussion about performance best practices. Jon asked me if there was any place where people got together to have that type of discussion. I couldn’t think of one so promised to talk to O’Reilly about the idea of a conference.
I emailed my editor, Andy Oram, and asked if he thought a performance conference was a good idea. He agreed to setup a meeting with Tim O’Reilly at OSCON. That meeting included people that I would end up working closely with for the next decade: Tim, Andy, Gina Blaber, Brady Forrest, Jon Jenkins, Artur Bergman, and Jesse Robbins. (There were others there as well and I apologize for not remembering.) I’m not sure, but I think Jon invited Jesse to the meeting. Both of them worked at Amazon where Jesse was the “master of disaster” – helping to create a resilient infrastructure for their services.
We discussed the idea of a conference combining performance and operations. It made sense. Both groups (or “tribes” as Jesse called them) focused on optimization. The tools and stacks might have been different, but the mindset was the same. The first Velocity was held June 2008. Jesse and I were the co-chairs. I remember being surprised and grateful when Gina called me to ask if I would co-chair. It seems like that was a long time ago.
Take a look at the speaker list for that first Velocity – it contains many people who were or would become luminaries in emerging fields of DevOps and WPO – Web Performance Optimization (aka, FEO – Frontend End Optimization):
- John Allspaw – future Velocity co-chair, current CTO at Etsy
- Artur Bergman – founder of Fastly and who would become my future boss
- Eric Goldsmith – worked with Pat Meenan at AOL on WebPageTest
- Jason Grigsby – mobile guru with me this week at Velocity again!
- Adam Jacob -Â CTO at Chef
- Luke Kanies – founder of Puppet Labs
- Eric Lawrence – OMG! Internet Explorer, Fiddler, now Google Chrome
- John Rauser – OMG! Amazon, Pinterest, Snapchat, also with me this week at Velocity again!
- Eric Schurman – Microsoft, now Amazon, and still on the Velocity Program Committee
- Stoyan Stefanov – member of the original Yahoo! Exceptional Performance team, creator of the Performance Calendar, now at Facebook
- Mandi Walls – keynoted at the very first Velocity, and sitting with me now in the Velocity speaker room again!
Transition
Yesterday, I announced this is my last Velocity as co-chair. I’ve been doing Velocity for a long time: nine years comprised of 21 shows (9 in California, 6 in Europe, 4 in New York, and 2 in Beijing). It feels good to open up the opportunity for someone else. Courtney Nash, who owns Velocity at O’Reilly, announced that performance will be merged with Fluent in 2017 to be chaired by Kyle Simpson and Tammy Everts. Also, Inés Sombra is the new co-chair for Velocity. The future looks good.
So many thank yous: O’Reilly Media for starting Velocity (and pushing me to accept that name over my choice, “Web Performance Conference”). Jesse Robbins, John Allspaw, James Turnbull and Courtney Nash for accepting me (putting up with me) as a Velocity co-chair. All the Program Committee members. The sponsors and vendors who supported Velocity. The amazing speakers over these past nine years. And all the attendees. We should pat each other on the back – it’s important to do that every once-in-a-while. We have created a strong, smart, caring, supportive community. Out of that have come numerous industries, technologies, and companies.
It has been an amazing experience. Thank you!
HTTP Archive switches to Chrome
The HTTP Archive crawls the world’s top URLs twice each month and records detailed information like the number of HTTP requests, the most popular image formats, and the use of gzip compression. In addition to aggregate stats, the HTTP Archive has the same data for individual websites plus images and video of the site loading. It’s built on top of WebPageTest (yay Pat!), and all our code and data is open source. HTTP Archive is part of the Internet Archive and is made possible thanks to our sponsors: Google, Mozilla, New Relic, O’Reilly Media, Etsy, dynaTrace, Instart Logic, Catchpoint Systems, Fastly, SOASTA mPulse, and Hosting Facts.
I started the HTTP Archive in November 2010. Even though I worked at Google, I decided to use Internet Explorer 8 to gather the data because I wanted the data to represent the typical user experience and IE 8 was the world’s most popular browser. Later, testing switched to IE 9 when it became the most popular browser. Chrome’s popularity has been growing, so we started parallel testing with Chrome last year in anticipation of switching over. This month, it was determined that Chrome is the world’s most popular browser.
In May 2011, I launched HTTP Archive Mobile. This testing was done with real iPhones. It started by testing 1,000 URLs and has “scaled up” to 5,000 URLs. I put that in quotes because 5,000 URLs is far short of the 500,000 URLs being tested on desktop. Pat hosts these iPhones at home. We’ve found that maintaining real mobile devices for large scale testing is costly, unreliable, and time-consuming. For the last year we’ve talked about how to track mobile data in a way that would allow us to scale to 1M URLs. We decided emulating Android using Chrome’s mobile emulation features was the best option, and started parallel testing in this mode early last year.
Today, we’re announcing our switch from IE 9 and real iPhones to Chrome and emulated Android as the test agents for HTTP Archive.
We swapped in the new Chrome and emulated Android data starting March 1 2016. In other words, if you go to HTTP Archive the data starting from March 1 2016 is from Chrome, and everything prior is from Internet Explorer. Similarly, if you go to HTTP Archive Mobile the data starting from March 1 2016 is from emulated Android, and everything prior is from real iPhones. For purposes of comparison, we’re temporarily maintaining HTTP Archive IE and HTTP Archive iPhone where you can see the data from those test agents up to the current day. We’ll keep doing this testing through June.
This switchover opens the way for us to expand both our desktop and mobile testing to the top 1 million URLs worldwide. It also lowers our hardware and maintenance costs, and allows us to use the world’s most popular browser. Take a look today at our aggregate trends and see what stats we have for your website.
Critical Metric: Critical Resources
A big change in the World of Performance for 2015 [this post is being cross-posted from the 2015 Performance Calendar] is the shift to metrics that do a better job of measuring the user experience. The performance industry grew up focusing on page load time, but teams with more advanced websites have started replacing PLT with metrics that have more to do with rendering and interactivity. The best examples of these new UX-focused metrics are Start Render and Speed Index.
Start Render and Speed Index
A fast start render time is important for a good user experience because once users request a new page, they’re left staring at the old page or, even worse, a blank screen. This is frustrating for users because nothing is happening and they don’t know if the site is down, if they should reload the page, or if they should simply wait longer. A fast start render time means the user doesn’t have to experience this frustration because she is reassured that the site is working and delivering upon her request.
Speed Index, a metric developed by Pat Meenan as part of WebPageTest, is the average time at which visible parts of the page are displayed. Whereas start render time captures when the rendering experience starts, Speed Index reflects how quickly the entire viewport renders. These metrics measure different things, but both focus on how quickly pages render which is critical for a good user experience.
Critical Resources
The main blockers to fast rendering are stylesheets and synchronous scripts. Stylesheets block all rendering in the page until they finish loading. Synchronous scripts (e.g., <script src="main.js">) block rendering for all following DOM elements. Therefore, synchronous scripts in the HEAD of the page block the entire page from rendering until they finish loading.
I call stylesheets and synchronous scripts “critical blocking resources†because of their big impact on rendering. A few months back I decided to start tracking this as a new performance metric as part of SpeedCurve and the HTTP Archive. Most performance services already have metrics for scripts and stylesheets, but a separate metric for critical resources is different in a few ways:
- It combines stylesheets and synchronous scripts into a single metric, making it easier to track their impact.
- It only counts synchronous scripts. Asynchronous scripts don’t block rendering so they’re not included. The HTTP Archive data for the world’s top 500K URLs shows that the median website has 10 synchronous scripts and 2 async scripts, so ignoring those async scripts gives a more accurate measurement of the impact on rendering. (I do this as a WebPageTest custom metric. The code is here.)
- Synchronous scripts loaded in iframes are not included because they don’t block rendering of the main page. (I’m still working on code to ignore stylesheets in iframes.)
Critical Metric
I’m confident this new “critical resources†metric will prove to be key for tracking a good user experience in terms of performance. Whether that’s true will be borne out as adoption grows and we gain more experience correlating this to other metrics that reflect a good user experience.
In the meantime, I added this metric to the HTTP Archive and measured the correlation to start render time, Speed Index, and page load time. Here are the results for the Dec 1 2015 crawl:
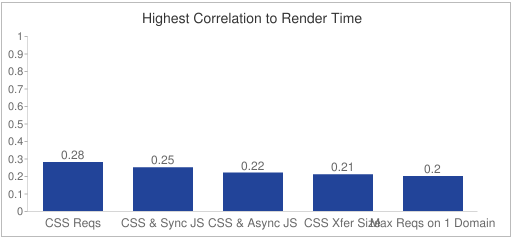
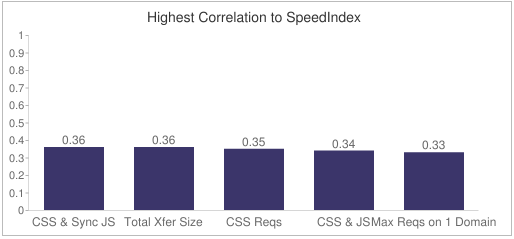

The critical resources metric described in this article is called “CSS & Sync JS†in the charts above. It has the highest correlation to Speed Index and the second highest correlation to start render time. This shows that “critical resources†is a good indicator of rendering performance. It doesn’t show up in the top five variables correlated to load time, which is fine. Most people agree that page load time is no longer a good metric because it doesn’t reflect the user experience.
We all want to create great, enjoyable user experiences. With the complexity of today’s web apps – preloading, lazy-loading, sync & async scripts, dynamic images, etc. – it’s important to have metrics that help us know when our user experience performance is slipping. Tracking critical resources provides an early indicator of how our code might affect the user experience, so we can keep our websites fast and our users happy.
HTTP Archive: past and future
Background
The HTTP Archive crawls the world’s top 500K URLs twice each month and records detailed information like the number of HTTP requests, the most popular image formats, and the use of gzip compression. We also crawl the top 5K URLs on real iPhones as part of the HTTP Archive Mobile. In addition to aggregate stats, the HTTP Archive has data (including waterfalls, filmstrips and video) for individual websites, for example, Apple, CNet, and YouTube.
Pat Meenan and I started the project in 2010 and merged it into the Internet Archive in 2011. The data is collected using WebPagetest. The code and data are open source. The project is funded by our generous sponsors: Google, Mozilla, New Relic, O’Reilly Media, Etsy, Radware, dynaTrace Software, Torbit, Instart Logic, Catchpoint Systems, Fastly, and SOASTA mPulse.
Past Year
Pat and I are always working to improve the HTTP Archive in terms of reach, metrics, and features. Here are some of the major achievements over the past year.
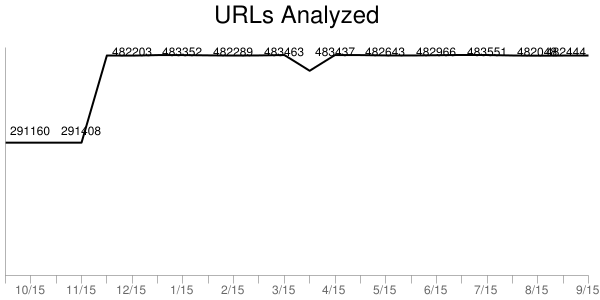
500K URLs: One of the most apparent changes in the last year is the increase from 300K to 500K URLs tested on desktop (using IE9). These are the world’s top URLs based on the Alexa Top 1,000,000 Sites. Our goal is to reach 1 million on both desktop and mobile.
New Hardware: Adding more URLs was possible when we upgraded our hardware adding a Supermicro 2U quad node server and ten Samsung 850 Pro 1TB SSDs. This added enough test capacity and storage to increase to 500K URLs. This new setup should be enough to allow us to go to 1 million URLs on both desktop and mobile once we settle on test environments. (More on that later.)
New Sponsors: In the past year Fastly and SOASTA mPulse joined our illustrious array of sponsors. This was critical in terms of finances since the new hardware greatly reduced our savings. Just last month we had to replace the SSDs on our original server and the funds from these new sponsors made that repair possible. Many thanks to all of the HTTP Archive sponsors for making this project possible.
Better Content Types: We improved how responses are classified into content types. The Content-Type response header is incorrect about 5% of the time, and these used to be classified as “other”. Now most of the “other” responses are given one of these new content classifications: video, audio, xml and text. As a result, the number of “other” responses dropped dramatically when this change was rolled out in April 2015.
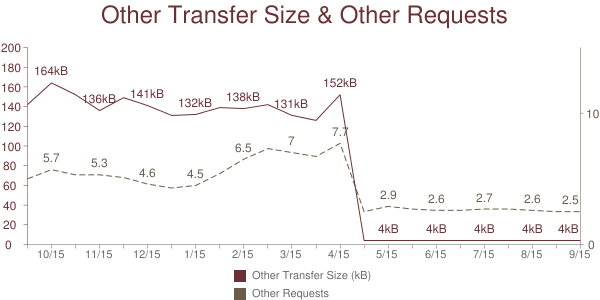
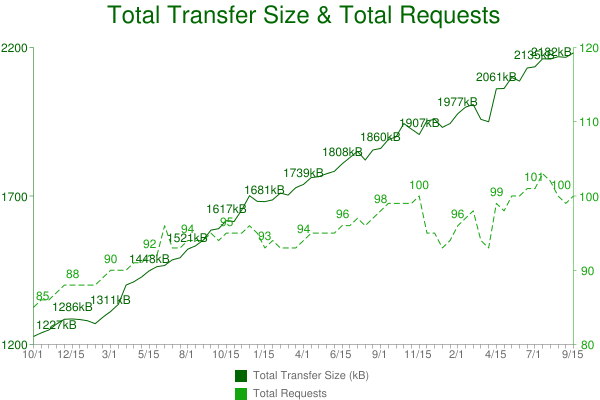
New Formats:Â In addition to improving content type classification, we added new code to detect the format for images (gif, jpg, png, webp, ico, & svg) and video (flash, swf, mp4, flv, & f4v). This allows us to do deeper comparisons of new formats such as WebP as shown in the chart below.
Chrome: From the inception of the HTTP Archive the goal was to do our testing on the browser version used by the most people in the world. Back in 2010 we used IE8 for all testing. A few years back we switched to IE9 when it became the most popular browser. Today, Chrome is the most popular browser so we need to switch to Chrome. In discussions with Pat and others in the HTTP Archive forum, we decided to run Chrome and IE9 side-by-side so we could compare the results before making the transition. Therefore, we created HTTP Archive Chrome back in May 2015.
Android: HTTP Archive Mobile processes 5K URLs using real iPhones, but it’s not feasible to scale this up to our goal of 1M URLs. Therefore, we’re evaluating using Chrome to emulate Android devices. In May 2015 we rolled out HTTP Archive Android to start gathering data in order to evaluate making this transition.
Looking Ahead
Our goal from the beginning has been to analyze the world’s top 1 million URLs. In order to do that we need to transition to using Chrome for desktop analysis and Chrome emulation for mobile. Now that we have months of data in HTTP Archive Chrome and HTTP Archive Android, the next step is to validate the results by comparing to the previous IE9 and iPhone results. It’s likely there will be differences, and we need to identify the causes for those differences before making the switch.
In addition to changing our test agents and increasing the number of URLs, we need to upgrade the charting software. We’re also going to focus on some new custom metrics that focus on identifying critical blocking resources.
Please check out these new changes in the HTTP Archive, HTTP Archive Mobile, HTTP Archive Chrome, and HTTP Archive Android. Make sure to search for your website to see your own performance history. If you have your own questions you’d like answered then try using the HTTP Archive dumps that Ilya Grigorik has exported to Google BigQuery and the examples from bigqueri.es. And send any other questions or suggestions to the HTTP Archive forum.
Hero Image Custom Metrics
The takeaways from this post are:
- If your website has a hero image, make sure it loads and renders as early as possible. Many designs that feature a hero image suffer from HID (Hero Image Delay) mostly due to blocking scripts and stylesheets.
- You should add custom metrics to your website to make sure you know how quickly (or slowly) important content gets displayed. I’ll describe a new technique for measuring when images are rendered so you can track that as a custom metric.
HID (Hero Image Delay)
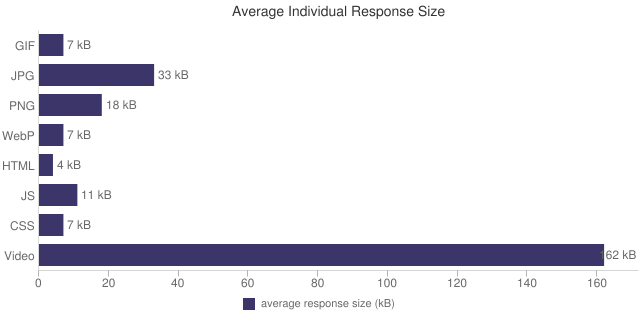
The size of websites is growing. The average website contains over 2 MB of downloaded content. Of that, 1.3 MB (65%) is images. Many websites use images as a major design element in the page – these are called hero images. Because these hero images are critical design elements, it’s important that they render quickly, and yet often hero images load too late frequently getting pre-empted by less critical resources on the page.
Popular websites that use hero images include Jawbone, Homeaway, and Airbnb. Using SpeedCurve’s Responsive Design Dashboard, we can see how their hero images load over time across different screen sizes.
Jawbone
Jawbone’s site features an image of a woman in a sweater wearing the Up fitness tracker. While this picture is stunning, it takes 2.5-3.5 seconds before it’s displayed.

Often we think that’s the price we have to pay for rich images like this – they simply take longer to download. But investigating further we find that’s often not the cause of the delayed rendering. Looking at the waterfall chart for Jawbone in Figure 2, we see that the image loaded in ~700 ms. (Look for the white URL ending in “sweater-2000.v2.jpg”.)
So why didn’t the hero image get rendered until almost 2600 ms? First, it’s referenced as a background image in a stylesheet. That means the browser’s preloader can’t find it for early downloading and the browser isn’t even aware of the image’s URL until after the stylesheet is downloaded and its rules are parsed and applied to the page. All of this means the image doesn’t even start downloading until ~650 ms after the HTML document arrives. Even after the image finishes downloading it’s blocked from rendering for ~550 ms by the scripts in the page.

Homeaway
Homeaway’s entire front page is one big hero image. Without the image, the page looks broken with a gray background and a floating form. For larger screen sizes, the hero image isn’t shown for over 2.5 seconds.
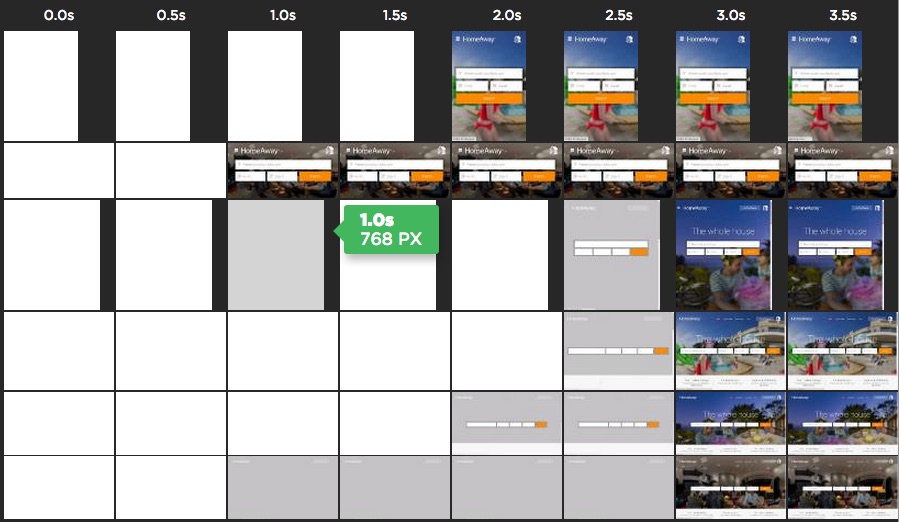
The Homeaway waterfall in Figure 4 shows that the (initial, low-res version of the) hero image loads early and quickly (request #9). But then it’s blocked from rendering for over 2 seconds by other scripts in the page.

Airbnb
Similar to Homeaway, Airbnb uses a beautiful hero image to cover nearly the entire front page. But again, this critical hero image is blocked from rendering for 1.5 to 2.5 seconds.

Once again, the hero image is blocked from rendering because of the many scripts on the page, but Airbnb’s waterfall shows an interesting effect of the preloader. While the preloader, overall, makes pages load much quicker, in this case it actually hurts the user experience for Airbnb users. The Airbnb home page puts several scripts at the bottom of the page, but doesn’t load them asynchronously. While moving scripts to the bottom was a good performance optimization in 2007, that was before preloaders were created. Today, for optimal performance it’s important to load scripts asynchronously.
In this case, when Airbnb is loaded in a modern browser those scripts at the bottom get scheduled earlier by the preloader and end up being requests 3, 5, 6 and 9. They add up to 238K of gzipped JavaScript. Ungzipped it turns into 797K of JavaScript that has to be parsed and executed before the hero image can be displayed.

Image Custom Metrics
Most of the performance metrics used today focus on the mechanics of the browser (window.onload) or network performance (time to first byte and Resource Timing). Unfortunately, these don’t tell us enough about what matters the most: the user’s experience. When does the page’s content get shown to the user so she can start interacting with the page?
To measure what matters, we need to shift our focus to metrics that better represent the user experience. These metrics are specific to each individual website measuring the most important design elements on each page. Because they must be created on a case-by-case basis we call them custom metrics. The earliest and most well known example of a custom metric is in a 2012 article from Twitter where they describe how their most important performance metric is Time to First Tweet, defined as “the amount of time it takes from navigation (clicking the link) to viewing the first Tweet on each page’s timeline.” Note that they don’t talk about how long it takes to download the tweets. Instead, they care about when the tweet can be viewed.
Sites that have hero images need to do the same thing: focus on when the hero image is viewed. This is trickier than it sounds. There are no hooks in today’s browsers that can be used to know when content is viewable. But we can find a solution by thinking about the three things that block an image from rendering: synchronous scripts, stylesheets, and the image itself being slow.
Talking to some web performance experts (thanks Philip, Pat, Scott, Andy and Paul!), I identified five candidate techniques for measuring when an image is displayed:
- Resource Timing
- image onload handler
- mutation observer
- polling for offsetHeight
- inline script timer
I created a test page that has a synchronous script, a stylesheet, and an image that are programmed to take a specific amount of time to download (3 seconds, 5 seconds, and 1 second respectively). Running them in WebPagetest I confirmed that the image isn’t displayed until after 5 seconds. I then implemented each of the techniques and found that:
- Resource Timing reports a time of ~1.5 seconds, which is accurate for when the image downloads but is not accurate for measuring when the image is viewable.
- The image onload handler, mutation observer, and polling techniques all report a time of ~3 seconds which is too early.
- Only the inline script timer technique reports a time that matches when the image is displayed.
This test page addresses the scenarios of a synchronous script and stylesheet. We still need to find an accurate measurement technique for the case when the image itself is slow to load. A slight variation of the test page includes a 7-second image and, of the five techniques, only Resource Timing and image onload handler correctly measure when the image is displayed – the other techniques report a time that is too early. Of those two, image onload is preferred over Resource Timing because it’s simpler and more widely supported.
Therefore, to create a custom metric that determines when an image is displayed you should take the max of the values reported by the inline script timer and image onload.
We’re all pretty familiar with image onload handlers. The inline script timer is simple as well – it’s just an inline script that records the time immediately following the IMG tag. Here’s what the code looks like:
<img src="hero.jpg" onload="performance.mark('hero1')">
<script>performance.mark('hero2')</script>
The code above takes advantage of the User Timing API. It’s easy to polyfill for browsers that don’t support it; I recommend using Pat Meenan’s polyfill. You need to take the max value of the hero1 and hero2 marks; this can be done either on the client or on the backend server that’s collecting your metrics. Refer to my test page to see live code of all five measurement techniques.
The most important thing to do is get your hero images to render quickly. Use Custom Metrics to make sure you’re doing that well.
Joining SpeedCurve
I’m excited to announce that I’m joining SpeedCurve!

SpeedCurve provides insight into the interaction between performance and design to help companies deliver fast and engaging user experiences. I’ll be joining Mark Zeman, who launched the company in 2013. We make a great team. I’ve been working on web performance since 2002. Mark has a strong design background including running a design agency and lecturing at New Zealand’s best design school. At SpeedCurve, Mark has pioneered the intersection of performance and design. I’m looking forward to working together to increase the visibility developers and designers have into how their pages perform.
During the past decade+ of evangelizing performance, I’ve been fortunate to work at two of the world’s largest web companies as Chief Performance Yahoo! and Google’s Head Performance Engineer. This work provided me with the opportunity to conduct research, evaluate new technologies, and help the performance community grow.
One aspect that I missed was having deeper engagements with individual companies. That was a big reason why I joined Fastly as Chief Performance Officer. Over the past year I’ve been able to sit down with Fastly customers and help them understand how to speed up their websites and applications. These companies were able to succeed not only because Fastly has built a powerful CDN, but also because they have an inspiring team. I will continue to be a close friend and advisor to Fastly.
During these engagements, I’ve seen that many of these companies don’t have the necessary tools to help them identify how performance is impacting (hurting) the user experience on their websites. There is even less information about ways to improve performance. The standard performance metric is page load time, but there’s often no correlation between page load time and the user’s experience.
We need to shift from network-based metrics to user experience metrics that focus on rendering and when content becomes available. That’s exactly what Mark is doing at SpeedCurve, and why I’m excited to join him. The shift toward focusing on both performance and design is an emerging trend highlighted by Lara Hogan’s book Designing for Performance and Mark’s Velocity speaking appearances. SpeedCurve is at the forefront of this movement.
We (mostly Mark) just launched a redesign of SpeedCurve that includes many new, powerful features such as responsive design analysis, performance budgets, and APIs for continuous deployment. Check it out and let us know what you think.

SERIOUS CONFUSION with Resource Timing
or “Duration includes Blocking”
Resource Timing is a great way to measure how quickly resources download. Unfortunately, almost everyone I’ve spoken with does this using the “duration” attribute and are not aware that “duration” includes blocking time. As a result, “duration” time values are (much) greater than the actual download time, giving developers unexpected results. This issue is especially bad for cross-origin resources where “duration” is the only metric available. In this post I describe the problem and a proposed solution.
Resource Timing review
The Resource Timing specification defines APIs for gathering timing metrics for each resource in a web page. It’s currently available in Chrome, Chrome for Android, IE 10-11, and Opera. You can gather a list of PerformanceEntry objects using getEntries(), getEntriesByType(), and getEntriesByName(). A PerformanceEntry has these properties:
- name – the URL
- entryType – typically “resource”
- startTime – time that the resource started getting processed (in milliseconds relative to page navigation)
- duration – total time to process the resource (in milliseconds)
The properties above are available for all resources – both same-origin and cross-origin. However, same-origin resources have additional properties available as defined by the PerformanceResourceTiming interface. They’re self-explanatory and occur pretty much in this chronological order:
- redirectStart
- redirectEnd
- fetchStart
- domainLookupStart
- domainLookupEnd
- connectStart
- connectEnd
- secureConnectionStart
- requestStart
- responseStart
- responseEnd
Here’s the canonical processing model graphic that shows the different phases. Note that “duration” is equal to (responseEnd – startTime).

Take a look at my post Resource Timing Practical Tips for more information on how to use Resource Timing.
Unexpected blocking bloat in “duration”
The detailed PerformanceResourceTiming properties are restricted to same-origin resources for privacy reasons. (Note that any resource can be made “same-origin” by using the Timing-Allow-Origin response header.) About half of the resources on today’s websites are cross-origin, so “duration” is the only way to measure their load time. And even for same-origin resources, “duration” is the only delta provided, presumably because it’s the most important phase to measure. As a result, all of the Resource Timing implementations I’ve seen use “duration” as the primary performance metric.
Unfortunately, “duration” is more than download time. It also includes “blocking time” – the delay between when the browser realizes it needs to download a resource to the time that it actually starts downloading the resource. Blocking can occur in several situations. The most typical is when there are more resources than TCP connections. Most browsers only open 6 TCP connections per hostname, the exceptions being IE10 (8 connections), and IE11 (12 connections).
This Resource Timing blocking test page has 16 images, so some images incur blocking time no matter which browser is used. Each of the images is programmed on the server to have a 1 second delay. The “startTime” and “duration” are displayed for each of the 16 images. Here are WebPagetest results for this test page being loaded in Chrome, IE10, and IE11. You can look at the screenshots to read the timing results. Note how “startTime” is approximately the same for all images. That’s because this is the time that the browser parsed the IMG tag and realized it needed to download the resource. But the “duration” values increase in steps of ~1 second for the images that occur later in the page. This is because they are blocked from downloading by the earlier images.
In Chrome, for example, the images are downloaded in three sets – because Chrome only downloads 6 resources at a time. The first six images have a “duration” of ~1.3 seconds (the 1 second backend delay plus some time for establishing the TCP connections and downloading the response body). The next six images have a “duration” of ~2.5 seconds. The last four images have a “duration” of ~3.7 seconds. The second set is blocked for ~1 second waiting for the first set to finish. The third set is blocked for ~2 seconds waiting for sets 1 & 2 to finish.
Even though the “duration” values increase from 1 to 2 to 3 seconds, the actual download time for all images is ~1 second as shown by the WebPagetest waterfall chart.

The results are similar for IE10 and IE11. IE10 starts with six parallel TCP connections but then ramps up to eight connections. IE11 also starts with six parallel TCP connections but then ramps up to twelve. Both IE10 and IE11 exhibit the same problem – even though the load time for every image is ~1 second, “duration” shows values ranging from 1-3 seconds.
proposal: “networkDuration”
Clearly, “duration” is not an accurate way to measure resource load times because it may include blocking time. (It also includes redirect time, but that occurs much less frequently.) Unfortunately, “duration” is the only metric available for cross-origin resources. Therefore, I’ve submitted a proposal to the W3C Web Performance mailing list to add “networkDuration” to Resource Timing. This would be available for both same-origin and cross-origin resources. (I’m flexible about the name; other candidates include “networkTime”, “loadTime”, etc.)
The calculation for “networkDuration” is as follows. (Assume “r” is a PerformanceResourceTiming object.)
dns = r.domainLookupEnd - r.domainLookupStart;
tcp = r.connectEnd - r.connectStart; // includes ssl negotiation
waiting = r.responseStart - r.requestStart;
content = r.responseEnd - r.responseStart;
networkDuration = dns + tcp + waiting + content;
Developers working with same-origin resources can do the same calculations as shown above to derive “networkDuration”. However, providing the result as a new attribute simplifies the process. It also avoids possible errors as it’s likely that companies and teams will compare these values, so it’s important to ensure an apples-to-apples comparison. But the primary need for “networkDuration” is for cross-origin resources. Right now, “duration” is the only metric available for cross-origin resources. I’ve found several teams that were tracking “duration” assuming it meant download time. They were surprised when I explained that it also including blocking time, and agreed it was not the metric they wanted; instead they wanted the equivalent of “networkDuration”.
I mentioned previously that the detailed time values (domainLookupStart, connectStart, etc.) are restricted to same-origin resources for privacy reasons. The proposal to add “networkDuration” is likely to raise privacy concerns; specifically that by removing blocking time, “networkDuration” would enable malicious third party JavaScript to determine whether a resource was read from cache. However, it’s possible to remove blocking time today using “duration” by loading a resource when there’s no blocking contention (e.g., after window.onload). Even when blocking time is removed, it’s ambiguous whether a resource was read from cache or loaded over the network. Even a cache read will have non-zero load times.
The problem that “networkDuration” solves is finding the load time for more typical resources that are loaded during page creation and might therefore incur blocking time.
Takeaway
It’s not possible today to use Resource Timing to measure load time for cross-origin resources. Companies that want to measure load time and blocking time can use “duration”, but all the companies I’ve spoken with want to measure the actual load time (without blocking time). To provide better performance metrics, I encourage the addition of “networkDuration” to the Resource Timing specification. If you agree, please voice your support in a reply to my “networkDuration” proposal on the W3C Web Performance mailing list.
Request Timeout
With the increase in 3rd party content on websites, I’ve evangelized heavily about how Frontend SPOF blocks the page from rendering. This is timely given the recent Doubleclick outage. Although I’ve been warning about Frontend SPOF for years, I’ve never measured how long a hung response blocks rendering. I used to think this depended on the browser, but Pat Meenan recently mentioned he thought it depended more on the operating system. So I decided to test it.
My test page contains a request for a script that will never return. This is done using Pat’s blackhole server. Eventually the request times out and the page will finish loading. Thus the amount of time this takes is captured by measuring window.onload. I tweeted asking people to run the test and collected the results in a Browserscope user test.
The aggregated results show the median timeout value (in seconds) for each type of browser. Unfortunately, this doesn’t reflect operating system. Instead, I exported the raw results and did some UA parsing to extract an approximation for OS. The final outcome can be found in this Google Spreadsheet of Blackhole Request Timeout values.
Sorting this by OS we see that Pat was generally right. Here are median timeout values by OS:
- Android: ~60 seconds
- iOS: ~75 seconds
- Mac OS: ~75 seconds
- Windows: ~20 seconds
The timeout values above are independent of browser. For example, on Mac OS the timeout value is ~75 seconds for Chrome, Firefox, Opera, and Safari.
However, there are a lot of outliers. Ilya Grigorik points out that there are a lot of variables affecting when the request times out; in addition to browser and OS, there may be server and proxy settings that factor into the results. I also tested with my mobile devices and got different results when switching between carrier network and wifi.
The results of this test show that there are more questions to be answered. It would take someone like Ilya with extensive knowledge of browser networking to nail down all the factors involved. A general guideline is Frontend SPOF from a hung response ranges from 20 to 75 seconds depending on browser and OS.