SPeeDY – twice as fast as HTTP
Mike Belshe and Roberto Peon, both from Google, just published a post entitled A 2x Faster Web. The post talks about one of the most promising web performance initiatives in recent memory – an improvement of HTTP called SPDY (pronounced “SPeeDY”). The title of their blog post comes from the impact SPDY has on page load times:
The initial results are very encouraging: when we download the top 25 websites over simulated home network connections, we see a significant improvement in performance – pages loaded up to 55% faster.
SPDY is an application-layer protocol, as is HTTP. The team chose to work at this layer, rather than the transport-layer of TCP, because it’s easier to deploy and has more potential for performance gains. After all, it’s been 10 years since HTTP/1.1, the most common version in use today, was defined. The main enhancements included in SPDY are summed up in three bullets:
- Multiplexed requests – Multiple requests can be issued concurrently over a single SPDY connection.
- Prioritized requests – Clients can request certain resources to be delivered first, for example, stylesheets as a higher priority over images.
- Compressed headers – HTTP headers (User-Agent, cookies, etc.) represent a significant number of bytes and yet are not compressed, whereas in SPDY they are compressed.
The reason this is so exciting is because it’s an improvement to the Internet infrastructure. If SPDY is adopted by web browsers and servers, users will get a faster experience without requiring them or web developers to do any extra work. This is what I call “fast by default” and is the theme for Velocity 2010. We still need developers to build their web applications using performance best practices, but getting the basic building blocks of the Web to be as fast as possible is in a way easier to wrangle and has a wider reach.
The SPDY team has published a white paper and DRAFT protocol specification. I say “DRAFT” in all caps because this is a proposal. The team is actively looking for feedback. They’ve also released a SPDY-enabled version of Chrome, and will release an open-source web server that supports SPDY in the near future. Read the FAQ to find out more about how this relates to HTTP pipelining, TCP, SCTP, and more. (I’m not sure I buy their answer for how the name was chosen.)
This needs lots of review. Please take a look and send your feedback to the Chromium discussion group.
Update: Checkout follow-up articles from Mark Nottingham (Yahoo!, chair of the IETF HTTPBIS Working Group) and Alex Russell (Google, Dojo contributor, coined the term Comet).
Velocity OLC in December (discount #velfall09pcd)
The in-person Velocity conference is slated for June 22-24, 2010 in Santa Clara. But you don’t have to wait until then to whet your performance and operations appetite. On December 8 (less than 4 weeks from now!) the first Velocity Online Conference will be held.
Sessions include:
- How Web Speed Affects Online Business KPIs – Hooman Behesti (Strangeloop)
- Faster Load Times Through Deferred JavaScript Evaluation – Charles Jolley (Apple)
- Load Balancing & Reverse Proxies with Varnish & More – Artur Bergman (Wikia)
- CouchDB from 10,000 Feet – Chris Anderson (couch.io)
- A Roundtable Panel of Some of Your Favorite Velocity Web Ops Ninjas
The beauty of this format is anyone, anywhere can join in – all you need is a computer and an Internet connection. I’m especially excited to see the turnout from the international community (having just returned from Sweden, Amsterdam, and Berlin). The cost is $149. Use the velfall09pcd discount code for a 25% discount when you register.
I hope to hear you online December 8th. Here’s to a faster Internet!
Who’s not getting gzip?
The article Use compression to make the web faster from the Google Code Blog contains some interesting information on why modern browsers that support compression don’t get compressed responses in daily usage. The culprit?
anti-virus software, browser bugs, web proxies, and misconfigured web servers. The first three modify the web request so that the web server does not know that the browser can uncompress content. Specifically, they remove or mangle the Accept-Encoding header that is normally sent with every request.
This is hard to believe, but it’s true. Tony Gentilcore covers the full story in the chapter he wrote called “Going Beyond Gzipping” in my most recent book, including some strategies for correcting and working around the problem. (Check out Tony’s slides from Velocity 2009.) According to Tony:
a large web site in the United States should expect roughly 15% of visitors don’t indicate gzip compression support.
This blog post from Arvind Jain and Jason Glasgow contains additional information, including:
- Users suffering from this problem experience a Google Search page that is 25% slower – 1600ms for compressed content versus 2000ms for uncompressed.
- Google Search was able to force the content to be compressed (even though the browser didn’t request it), and improved page load times by 300ms.
- Internet Explorer 6 downgrades to HTTP/1.0 and drops the Accept-Encoding request header when behind a proxy. For Google Search, 36% of the search results sent without compression were for IE6.
Is there something about your browser, proxy, or anti-virus software that’s preventing you from getting compressed content and slowing you down 25%? Test it out by visiting the browser compression test page.
Security tests added to Browserscope
Today, the first new test suite for Browserscope was launched: Security.
Browserscope is an open source project for measuring browser capabilities. It’s a resource for users and developers to see which features are or are not supported by any particular browser. All of the data is crowdsourced, making the results more immediate, diverse, and representative. Browserscope launched in September (see my blog post) with tests for network performance, CSS selectors, rich text edit controls, and Acid3.
The new security tests in Browserscope were developed by Adam Barth from UC Berkeley, and Collin Jackson and Mustafa Acer from Carnegie Mellon University. It’s exciting to have these experts become Browserscope contributors. The tests cover such areas as postMessage API, JSON.parse API, httpOnly cookie attribute, and cross-origin capability leaks. See the Security about page to read about all the tests.
This is the point at which you can contribute. We don’t want your money – all we want is a little bit of your time to run the tests. Just click on the link and sit back. All that’s needed is a web client that supports JavaScript. We especially want people to connect using their mobile devices. If you have suggestions about the tests, contact us or submit a bug.
So far we’ve collected over 30,000 test results from 580 different browsers. Want to see how your browser compares? Just click on this button to add your browser’s results to Browserscope.
Firebug Net Panel: more accurate timing
There’s a lot of work that transpires before I can recommend a performance tool. I have to do a large amount of testing to verify the tool’s accuracy, and frequently (more often than not) that testing reveals inaccuracies.
Like many web developers, I love Firebug and have been using it since it first came out. Firebug’s Net Panel, thanks to Jan (“Honza”) Odvarko, has seen huge improvements over the last year or so: customized columns, avoiding confusion between real requests vs. cache reads, new (more colorful!) UI, and the recent support of export.
Until now, Net Panel suffered from an accuracy problem: because Net Panel reads network events in the same JavaScript thread as the main page, it’s possible for network events to be blocked resulting in inaccurate time measurements. Cuzillion is helpful here to create a test case. This example has an image that takes 1 second to download, followed by an inline script that takes 5 seconds to execute, and finally another 1 second image. Even though the first image is only 1 second, the “done” network event is blocked for 5 seconds while the inline script executes. In Firebug 1.4’s Net Panel, this image incorrectly appears to take 5 seconds to download, instead of just 1 second:

Honza has come through again, delivering a fix to this problem in Firebug 1.5 (currently in beta as firebug-1.5X.0b1 which requires Firefox 3.6 beta). The fix included help from the Firefox team to add the actual time to each network event. The results are clearly more accurate:

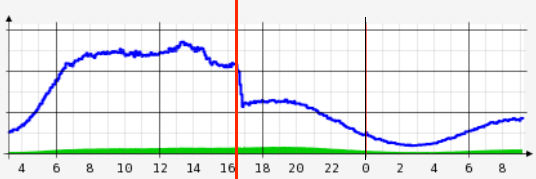
A few other nice features to point out: Firebug Net Panel is the only packet sniffer I’m aware of that displays the DOMContentLoaded and onload events (blue and red vertical line). Firebug 1.5 Net Panel has multiple columns available, and the ability to customize which columns you want to display:

With these new features and improved timing accuracy, Firebug Net Panel is a great choice for analyzing HTTP traffic in your web pages. If you’re not subscribed to Honza’s blog, I recommend you sign up. He’s always working on something new that’s helpful to web developers and especially to Firebug users.
Note 1: Remember, you need both Firefox 3.6 beta and firebug-1.5X.0b1 to see the new Net Panel.
Note 2: This is being sent from Malmö, Sweden where I’m attending Øredev.
SpeedGeeks LA at Shopzilla
I co-hosted a great web performance meetup yesterday called SpeedGeeks LA. The idea started when Phil Dixon invited me down to Shopzilla to give a talk. (Phil and I have stayed in touch after his amazing session at Velocity 2009.) Phil suggested we invite some other performance-minded companies in the area, and then we started talking about expanding it to include more speakers. We ended up with over 3 hours of presentations and nearly 150 people.
We had a great mix of talks (I hope to post all slides soon):
- In Search of Speed – I kicked it off talking about the importance of progressive enhancement as an enabler of progressive rendering. (slides)
- You Get What You Measure – A reprise of Phil’s talk from Velocity that includes the oft-cited stats about a 7-12% increase in revenue and 50% drop in server load thanks to faster performance.
- A Holistic Approach to Building a High Performance Web Site – Paddy Hannon (Edmunds) – A no-nonsense approach to instilling performance into the development process.
- Latency Improvements for PicasaWeb – Gavin Doughtie (Google) – Great tips from a web guru about what makes PicasaWeb fast.
- Performance-as-a-service – Morten Begai (Heroku) – Performance built-in to their Rails hosting environment.
- MSFast – Jeremy Custenborder, Yadid Ramot (MySpace) – Demo of MSFast plus a preview of what looks to be an awesome Flash profiler. Watch for it!
- Trace Down JavaScript & AJAX Performance in IE – Andreas Grabner (dynaTrace) – Check out their new dynaTrace Ajax Edition tool.
- Application Architecture Determines Application Performance – Randy Stafford (Oracle) – A reminder that sometimes you need to focus on backend performance, too.
Oracle was kind enough to sponsor lunch for everyone and raffle off a Wii. How awesome is that?!
A huge shoutout to Phil and the folks at Shopzilla, especially Lauren Moser. They hosted everyone at their headquarters and even handed out swag bags. The space was setup perfectly, with room for folks to group into smaller conversations during breaks. Just a top notch operation on all fronts.
I’m calling this the inaugural event for SpeedGeeks. My hope is that LA is just the first of many cities where SpeedGeeks gather to share knowledge about make the web faster. I’d like to see SpeedGeeks expand in a similar way as how Ignite events take place worldwide. If you’d like to pull together such an event in your city, contact me and we can brainstorm. I can rally performance gurus in the area and, who knows, I might even be able to drop-in and help co-host.
SpeedGeeks of the world unite!
HTTP Archive Specification: Firebug and HttpWatch
A few years ago, I set a goal to foster the creation of an Internet Performance Archive. The idea is similar to the Internet Archive. But whereas the Internet Archive’s Wayback Machine provides a history of the Web’s state of HTML, IPA would provide a history of the Web’s state of performance: total bytes downloaded, number of images|scripts|stylesheets, use of compression, etc. as well as results from performance analysis tools like YSlow and Page Speed. Early versions of this idea can be seen in Show Slow and Cesium.
I realized that a key ingredient to this idea was a way to capture the page load experience, basically, a way to save what you see in a packet sniffer. Wayback Machine archives HTML, but it doesn’t capture critical parts of the page load experience like the page’s resources (scripts, stylesheets, etc.) and their HTTP headers. It’s critical to capture this information so that the performance results can be viewed in the context of what was actually loaded and analyzed.
What’s needed is an industry standard for archiving HTTP information. The first step in establishing that industry standard took place today with the announcement of HttpWatch and Firebug joint support of the HTTP Archive format.
HttpWatch has long supported exporting HTTP information. That’s one of the many reasons why it’s the packet sniffer I use almost exclusively. Earlier this year, as part of the Firebug Working Group, I heard that Firebug wanted to add an export capability for Net Panel. I suggested that, rather than create yet another proprietary format, Firebug team up with HttpWatch to develop a common format, and drive that forward as a proposal for an industry standard. I introduced Simon Perkins (HttpWatch) and Jan “Honza” Odvarko (main Net Panel developer), then stepped back as they worked together to produce today’s announcement.
The HTTP Archive format (HAR for short – that was my contribution ;-) is in JSON format. You can see it in action in HttpWatch 6.2, released today. HAR has been available in Firebug for a month or so. You need Firebug 1.5 alpha v26 or later and Honza’s NetExport add-on (v0.7b5 or later).
Here’s what the end-to-end workflow looks like. After installing NetExport, the “Export” button is added to Firebug Net Panel. Selecting this, I can save the HTTP information for my Google flowers search to a file called “google-flowers.har”.

After saving the file, it’s automatically displayed in Honza’s HTTP Archive Viewer web page:

I can then open the file in HttpWatch:

I’m incredibly excited to see this milestone reached, thanks to the work of Honza and Simon. I encourage other vendors and projects to add support for HAR files. The benefits aren’t limited to performance analysis. Having a format for sharing HTTP data across tools and browsers is powerful for debugging and testing, as well. One more block added to the web performance foundation. Thank you HttpWatch and Firebug!
Øredev, Fronteers, JSConf.eu
A contingent of web dev gurus are on their way to Europe the first week of November for some awesome conferences. If you haven’t signed up, check into it soon – seats are going fast.
The gurus I’ve been coordinating with include John Resig, Doug Crockford, Ben Galbraith, and Dion Almaer. But there’s more! Other speakers/friends who I’m excited to techdown with are Christian Heilmann, PPK, Nicole Sullivan, Richard Campbell, Kyle Simpson, and Tom Hughes-Croucher.
The conferences (in chronological order) are:
- Øredev (Nov 2-6, Malmö, Sweden) – Malmö is right across the channel from Copenhagen. I’ve never been to Denmark or Sweden, so am psyched to check this out (and bring back some legos).
- Fronteers (Nov 5-6, Amsterdam) – This is what started it all for me. I heard the reviews of Fronteers 2008 and swore I was going to go this year. I have a lot of respect for PPK’s work, and am honored he asked me to present. I visited Amsterdam a few times and loved it, but it’s been 15 years so I’m excited to get back. Unfortunately, Fronteers 2009 is already sold out! If you didn’t get a ticket, check out one of the other conferences.
- JSConf.eu (Nov 7-8, Berlin) – I heard great things about JSConf in DC and wanted to get to know this group. It’s great that it follows so closely after Fronteers. My ancestors came from Germany, so I look forward to visiting Germany again.
I’ll be presenting at all three conferences, giving away a few books, and sitting down with developers in these countries to discuss the tech challenges they face, and hopefully pick up some best practices, especially with regard to performance.
I am so psyched for this trip! My wife and kids are bummed they’re not coming, so I can’t show any excitement at home. (Luckily, my wife doesn’t read my blog – don’t tell her how excited I am!) All three of these conferences are going to be great. I hope to see you there!
@font-face and performance
Last week I was reading Ajaxian (my favorite blog) and saw the post about @font-face. I had been wondering for a few months about how font files impact web performance, so I followed the story back to Zoltan Hawryluk’s original post: @font-face in Depth. A great read on the aesthetics, mechanics, and compatibility issues of fonts, but not much about performance. I added a comment:
How does this impact performance? Do font file downloads happen in parallel with other resources? Are they downloaded at declaration (â€@font-face {}â€), when used in a style (â€body { font-family: }â€), or when a DOM element uses a style that uses the font? Do they follow the normal HTTP caching behavior? Can they be gzipped?
I started doing some research to answer these questions, but during that time there have been a number of great posts about @font-face performance issues:
- Paul Irish: Fighting the @font-face FOUT
- Stoyan Stefanov: Gzip your @font-face files
- Zoltan Hawryluk (again): More @font-face fun
This blog post summarizes Paul, Stoyan, and Zoltan’s findings plus some very important discoveries of my own.
FOUT: Flash of Unstyled Text
Paul refers to FOUT as the “flash of unstyled text”. This is a nod to the term FOUC coined by David Hyatt for “flash of unstyled content”. FOUC occurs when stylesheets are loaded late in the page. (FOUC is the justification for Rule 5 – Put Stylesheets at the Top from High Performance Web Sites.)
Paul comments on two versions of FOUT:
- re-rendered text – Firefox renders text using a default font while the @font-face file is being downloaded. Once the font file is downloaded, Firefox re-renders the text using the correct font.
- invisible text – Most other browsers don’t draw the text at all until the font is downloaded.
I found an even worse FOUT issue:
- IE doesn’t render anything in the page until the font file is done downloading.
- IE doesn’t render anything in the page until the font file is done downloading if there is a SCRIPT tag above the @font-face declaration.
My examples all have a SCRIPT tag at the top of the page containing code for measuring the page load time. This is what causes rendering to be blocked in IE. The fix is simple – make sure all SCRIPT tags are below the @font-face declaration. Using the IE Fix test page, you can see that the page renders immediately. After the font file is done downloading (six seconds), the stylized text is re-rendered. Using this fix brings IE on par with Firefox.
But this IE behavior is still an issue that the IE team should try to fix. A quick survey shows that seven of the Alexa U.S. top ten web sites have a SCRIPT tag above their stylesheets or STYLE blocks: AOL, Facebook, Google, Bing, MSN, MySpace, and Yahoo!. These web sites don’t currently use @font-face, but if they did, they would experience the IE blocked rendering problem. This raises the concern that other web sites that are early adopters of @font-face have a SCRIPT tag above @font-face and their IE users run the risk of experiencing blocked rendering.
You can see this using my FOUT Test where the font file takes six seconds to download – in IE the entire page is white until six seconds pass, even though the HTML text and other parts of the page already arrived at the browser. (This is critical when considering outage scenarios – see the @font-face Outage section that follows.)
All of these FOUT situations are bad for the user experience. It’s jarring for the user to have parts of the page appearing or changing while they view it. And it’s not just the @font-face text that’s the problem – all browsers except IE will likely have to re-render other parts of the page if the default font and @font-face font are different sizes.
FOUT doesn’t impact web page performance in terms of absolute load times, but it does affect the user’s perception of page speed, and that’s what we’re really trying to optimize.
Blocking Other Downloads
When it comes to the question of whether font files block other downloads, the short answer is “no”. I created the Blocking Test to measure whether font files block other resources from being downloaded. The test page contains some text that uses a font downloaded via @font-face. This text is followed by an image, an iframe, a stylesheet, and an external script. Each of these four resources as well as the font file are configured to take two seconds to download. In all major browsers, the page loads in two seconds, meaning no files were blocked.
Note that font files are subject to the same connections-per-hostname limits as other resources. Run the Per Hostname Test to see the limits for your browser. In the Blocking Test, I sharded the resources across multiple domains to avoid any connection limits. But if font files were served from the same domain as other resources, then blocking could occur if the connections-per-hostname limit was exceeded.
Browser Busy Indicators
Although font files don’t block other downloads, they do trigger the browser’s busy indicators. This has a negative effect on the user’s perception of page speed because it gives the impression that the page takes a long time to load. The busy indicators that are triggered vary by browser, according to the following table.
| Browser | Status Bar | Progress Bar | Icon | Cursor |
|---|---|---|---|---|
| IE7 | X | X | X | |
| IE8 | X | X | X | |
| Firefox 3.5 | X | X | X | |
| Safari 4 | X | X | X | |
| Chrome 3 | X | X | X |
Note that font files block the window’s onload event from firing in IE and Firefox, but not Safari nor Chrome. This is seen by running the FOUT Test – the page load time is six seconds for IE and Firefox, a few hundred milliseconds for Safari and Chrome.
Wasteful Downloads
Paul credits Garrick from Kernest for pointing out that IE is a little jumpy when it comes to downloading fonts. IE starts downloading the font file as soon as it encounters the @font-face declaration. This means IE downloads the font file even if no elements in the page use the font.
You can verify this with my Unused Font Test. This page has an @font-face declaration, but nothing in the page uses the font. In this page, the font file is configured to take six seconds to download. Sure enough, the overall page load time in IE is six seconds, indicating that the font file was downloaded even though it’s not used. Perhaps IE adopted this approach to avoid the FOUT problem, but given the likelihood of @font-face occurring even if the font isn’t used in the current page, this behavior is likely to result in many wasteful downloads and an overall degradation in performance.
Compression
Stoyan’s post about gzipping font files is a must read. Paul initially thought this wasn’t possible, and I followed suit. Thank goodness Stoyan did the legwork to show that, in fact, you should compress font files. His survey results show a savings of 40% or more for TTF, OTF, and EOT files. I now have Apache configured to compress my font files.
Caching
Font files are cacheable, just like any other resource. You can see this in the Cache Test. The font file is configured to take six seconds to download, so the first time you visit the page, the load time is a little over six seconds. But the font file has a far future Expires header, so clicking on the Cache Test link again happens more quickly since the font file is read from the browser’s cache.
@font-face Outage
Given the FOUT and browser busy issues caused by font files, we need to think about the worst case scenario: What if there’s an issue with the server hosting the font file – what happens if it times out or takes an extremely long time to respond? The Outage Test shows what happens in this situation, and it’s not pretty. The font file in this test is configured to take 20 seconds to download. Here are the results:
- IE: Recall from the FOUT Test that in IE, nothing in the entire page is rendered until the font file is done downloading. This is true even if the @font-face style is below everything else in the page. If you load the Outage Test in IE, nothing will render for 20 seconds. Ouch!
- In Firefox, the text is drawn in a default font, then redrawn once the font file is downloaded after 20 seconds.
- In most other browsers, the text isn’t drawn for 20 seconds, but the rest of the page is rendered.
Prompted by Annie Sullivan, I tried to find the maximum time a browser would spend trying to download a font file. The maximum download time I tested was 10 minutes. Safari did the best: after 60 seconds it bailed and rendered the stylized text with a default font. IE did the worst: with a 10 minute download time, IE still showed a blank white page. Firefox drew the text in a default font immediately (its normal behavior), but its busy indicators continued to agitate for 10 minutes. Chrome never rendered the text, and its busy indicators continued for the full 10 minutes.
These slow response and outage issues raise significant concerns for anyone considering using @font-face. It’s different from what happens when an image times out and the page ends up showing the broken image icon. If a font file fails to return, the page is blocked in IE, the text isn’t displayed in Chrome, and the browser’s busy indicators never stop in IE, Firefox, and Chrome (at least for 10 minutes).
@font-face Performance Advice
My first piece of advice is to avoid using @font-face unless it’s critical to the page.
The primary reason for this advice is the risk that font files will block rendering of the entire page in IE until they’re done downloading if there is a SCRIPT tag above the @font-face declaration. Stylesheets also have this blocked rendering problem. But stylesheets provide styling for all aspects of the entire page, whereas font files only add one thing – a custom font.
If you’re not deterred by the FOUT and outage issues, and want to push on to use @font-face, I recommend deferring the font file download until after the page has rendered, as shown in the Lazy Load Test. This solves the issues in IE – the page renders and then the font is downloaded in the background and enhances the stylized text once it arrives. This technique has benefits in other browsers, as well. By lazy loading the font file, most of the browser busy indicators aren’t triggered. The lazy load code looks like this:
function lazyload() {
	var sRule1 =
		"@font-face {" +
		"  font-family: 'Yanone';" +
		"  src: url('/bin/resource.cgi?type=font&sleep=6');" +
		"  src: local('Yanone'), " +
                "url('/bin/resource.cgi?type=font&sleep=6') " +
                "format('truetype');" +
		"}";

	var style1 = document.styleSheets[0];
	if ( "function" === typeof(style1.insertRule) ) {
		// Firefox, Safari, Chrome
		style1.insertRule(sRule1, 0);
	}
	else if ( "string" === typeof(style1.cssText) ) {
		// IE
		style1.cssText = sRule1;
	}
}
This is a prototype, not a hardened solution. There are shortcuts here (styleSheets[0] is an empty style block in the page). In Safari and Chrome there is a slight flash of the stylized text. I talk about some possible workarounds in the test page itself.
In Paul’s post he talks about prefetching font files, but notes that the technique doesn’t apply to IE. I consider IE to be the most significant problem to solve. Also, I would tend to put stylesheets and scripts, and in some cases images, at a higher priority to download than font files. It depends on the page and how the font file is used.
I don’t recommend using data: URIs in place of the font files in stylesheets. That could double the amount of data that was downloaded, since the stylesheet would have to contain the data for both the EOT and TTF files. This would also make stylesheets take longer to download, and stylesheets block rendering in almost all browsers.
Summing up:
- Only use @font-face if you’re absolutely certain you need it.
- Put your @font-face declaration above all SCRIPT tags.
- If you have multiple font files, consider sharding them across multiple domains.
- Don’t include unused @font-face declarations – IE will download them whether they’re used or not.
- Gzip the font files and give them a future Expires header.
- Consider lazy loading the font files, at least in IE.
Given the high number of posts about @font-face recently, I expect we’ll see more performance issues and workarounds as we grapple with how to use this feature in today’s browsers while ensuring our users get the fast experience they want and deserve.
Business impact of high performance

Alistair Croll adds more evidence to the business case for high performance web sites in his blog post Proof that speeding up websites improves online business. This was the primary theme of Velocity 2009, and major web destinations shared their business case studies, including Bing, Google, and Shopzilla. Alistair rounds out the stats by answering the question: How big an impact does performance optimization have on the business metrics of a typical media or e-commerce site?
Alistair worked with his friends at Strangeloop Networks to gather the data. Strangeloop makes acceleration appliances that automatically optimize dynamic web apps in real time. They left the appliance off for half of the visitors and turned it on for the other half, and compared the differences. Some highlights from what they found:
- pages per visit grew from 11.04 to 15.64
- time spent on the site went from 23:50 to 30:10
- conversion rate increased 16.07%
- order value increased 5.51%
In addition to these metrics, we have data that shows improving web performance reduces operating costs. In his talk about Shopzilla’s performance improvements (video, slides), Phil Dixon mentions that the number of servers required to run their site dropped in half. Netflix’s outbound traffic dropped almost 50% as a result of the work done by Bill Scott and his team.
Web Performance Optimization improves user and business metrics. WPO also decreases operating costs by reducing hardware requirements and bandwidth, which in turn reduces carbon footprint. It’s a win on all fronts. We’re going to see even more case studies on the positive impact of performance optimization, and as a result, the interest in learning more about this field will continue to grow. In addition to speaking at Øredev, Fronteers, and JSConf.eu, I’m organizing a few other performance meetups in the next few months. Watch my blog for announcements.