Page weight grows 24% year-over-year (not 44%)
SHORT: Earlier this week I reported that the average page weight for the Alexa Top 1000 websites increased 44% in 1 year. The actual stat is 24%.
LONG: On Monday I delivered a keynote at the HTML5 Developer Conference entitled “How fast are we going now?” (slides available on SlideShare and as PPTX). I talked about several aspects of “fast” – connection speeds, browser performance, page load times, code quality, and page weight. (I’ll publish a blog post version of that talk next week.)
I gathered the page weight stats from the HTTP Archive – a project I run that’s been gathering web metrics for the past 2.5 years. The specific chart I referred to was Total Transfer Size & Total Requests for the Alexa Top 1000 URLs from March 15 2012 to March 15 2013:
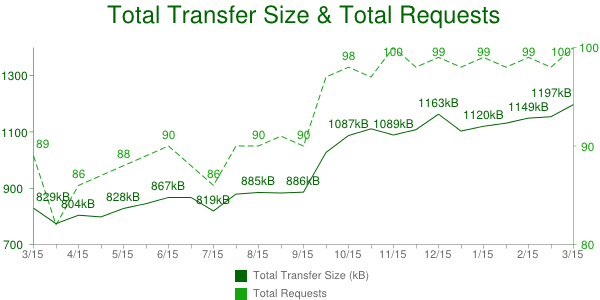
As shown in this chart, the average transfer size for these Top 1000 pages grew from 829 kB to 1197 kB year-over-year, an increase of 368 kB or 44%. However, there’s also a noticeable jump around October 1 2012. I flagged this for later investigation while I rushed to finish my slides.
After the keynote I dug deeper to find the cause of that jump and discovered that it was due to a change in the test environment. Previously the network traffic for each page was recorded up until document complete (window.onload). On October 1 2012 the test configuration was changed to include HTTP requests that occurred after document complete. This is why the total transfer size jumped – the window of time being monitored was increased resulting in more HTTP requests being counted.
As a result, this trend chart is comparing apples and oranges, and so was I. Luckily all the data in the HTTP Archive is, well, archived, so I was able to go back and recompute the stats to get an apples-to-apples comparison. The total transfer size up to document complete is 829 kB for March 15 2012 and 1031 kB for March 15 2013. That’s an increase of 202 kB or 24%.
I feel terrible about making this mistake, but I feel even worse about the folks who were kind enough to spread the word via Twitter and other forums. They did so, in part, based on a level of trust that what I say is accurate. I’m a stickler for details. This mistake is out of character and I’ll work harder to avoid similar mistakes in the future.
Specific steps that I’m taking:
- Don’t rush to release stats without investigating anomalies – rookie mistake.
- Track changes to the environment better – I do this now in the HTTP Archive News page but have not been keeping it up-to-date. I’ve updated it and will keep it current going forward.
- Annotate charts to indicate when changes were made – This has been a long-standing bug. I need to completely revamp all the charts and will tackle this as part of that change.
- A final issue is what to do with these transfer size charts. I believe it’s a better reflection of the Web to include lazy-loaded resources. That’s a newer trend that is getting wider adoption. So I want this chart to reflect the stats we’re currently collecting. Unfortunately, the total transfer size including post-onload resources isn’t available retroactively because the tests conducted prior to Oct 1 2012 were stopped at window.onload – that later network activity wasn’t archived. As a result, comparing transfer sizes before and after Oct 1 2012 is apples-and-oranges. Adding chart annotations would fix that. In the near term I’ve added the following footnote below each transfer size chart containing a link to an FAQ item with more info: “Transfer sizes prior to Oct 1 2012 are smaller due to a change in testing.”
The HTTP Archive is a great resource for trends in web performance. Mistakes are rare. I apologize for this error especially to those who forwarded the mistaken info.
But back to the correct stat – 24% is still too big! The previous year saw a 25% increase (transfer size up to document complete for the Top 1000 URLs Mar 15 2011 to Mar 15 2012). Video plays an interesting role in this increase. Watch for my blog post next week for more info.
Nicholas Shanks | 08-Apr-13 at 12:09 am | Permalink |
First you say “Luckily all the data in the HTTP Archive is, well, archived, so I was able to go back and recompute the stats to get an apples-to-apples comparison.” but then you say “Unfortunately, the total transfer size including post-onload resources isn’t available retroactively because the tests conducted prior to Oct 1 2012 were stopped at window.onload”.
After reading the first of those, I inferred that you went back and boosted the page size for the pages before October 2012, since “all the data was archived”. After reading the second, I now suspect you actually lowered the page sizes from October onwards to get to 24%. Which is correct? Could you please add a clarification, e.g. “so I was able to go back and recompute the more recent stats to show just the page size up until onload”.
Steve Souders | 08-Apr-13 at 8:13 am | Permalink |
Nicholas: Everything that’s recorded is archived – so even though the post-Oct-1-2012 numbers include lazy loaded resources, I’m able to go back and strip those out (lower the page size). There’s no way to boost the page sizes prior to Oct 1 2012 because nothing was recorded after document complete. That’s why when I describe doing an apples-to-apples comparison the stat I give is the “total transfer size up to document complete”.